What this tool does
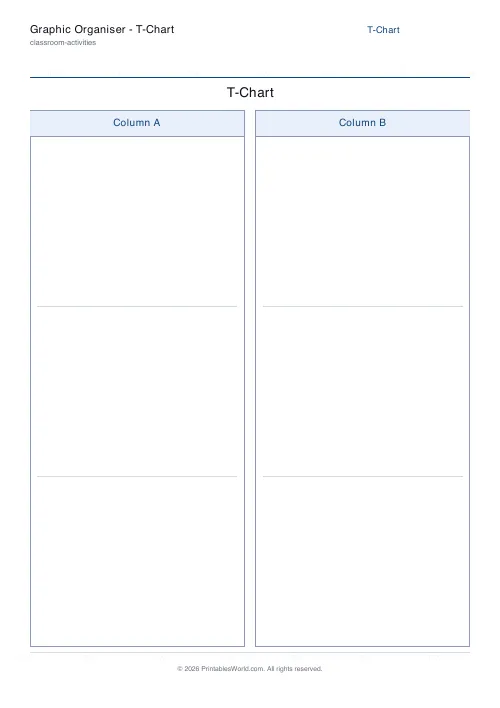
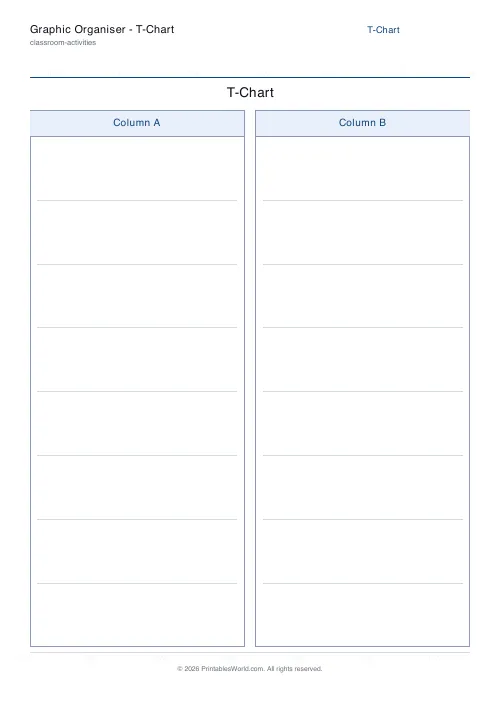
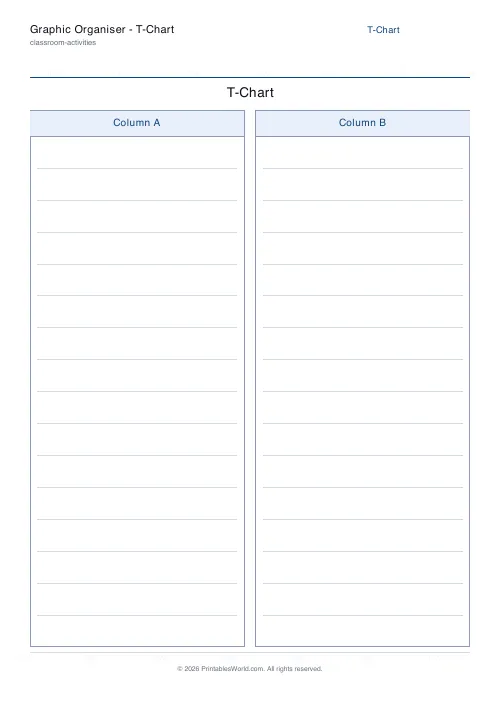
A two-column T-chart with your own headings and 3 to 16 ruled rows on each side. For pros and cons, before and after, sorting, or any two-way comparison.
People also used
KWL Chart Template
Three-column "Know, Want to Know, Learned" graphic organiser, fillable and printable.
Concept Map Template
Root concept with hierarchical linked boxes in a tidy tree layout.
Bingo Card Generator
Generate unique printable bingo cards with custom words, FREE centre toggle, call sheet, and seeded shuffles.
Feedback
Spotted something off with this tool?
Two columns and a line down the middle
Set a title and a heading for each column, choose how many ruled rows each side gets, and print. Three to sixteen rows.
It is the simplest organiser there is, which is why it gets used more than the elaborate ones. There is nothing to explain and nothing to get wrong.
The headings do all the work
The sheet is generic; the headings decide what it is.
Pros / Cons for a decision. Before / After for a change. Fact / Opinion, which is a better sorting exercise than it sounds and catches out more secondary students than anyone expects. Cause / Effect, Problem / Solution, What I did / What I would change.
Also just two categories to sort into. Odd and even. Living and non-living. Metal and non-metal. Nouns and verbs.
Row count matters more than it looks
The number of rows is read as an instruction, and it will be obeyed.
Print five rows and you will get about five items. Print sixteen and people will keep going until they run out or the page does. So set it to the number of items you actually want, and accept that a T-chart with sixteen rows on a topic with four real points will get padded with repetition.
For a pros and cons chart specifically, equal rows on both sides is a quiet nudge to find as many of one as the other, which is usually the right nudge.
Where a T-chart beats a Venn diagram
When the two things have nothing to share. Pros and cons do not overlap; neither do before and after. Forcing that onto a Venn diagram leaves a middle region that is either empty or filled with nonsense.
Use a Venn when the interesting part is what the two have in common. Use a T-chart when it is the contrast itself.
Reading a completed one
Count the two sides. A pros-and-cons chart with nine pros and one con has usually been filled in by somebody who had already decided, and pointing that out is more useful than arguing about the content.
Then ask which single row matters most. A list of ten equally-weighted points is not a decision, and the step from listing to weighing is the one nobody does voluntarily.
On the form
Title, left heading, right heading, rows per column (3–16), and optional Name and Date fields. A4 or US Letter.
Print at 100% on A4 or US Letter.
FAQs
Quick answers
What is a T-chart used for?
A T-chart splits a page into two labelled columns so pupils can compare two things, sort items into two groups, or weigh pros and cons. It suits any task with two sides to it.
Can I set my own column headings?
Yes. Type a heading for each column, or leave them blank so pupils write their own labels. The title line above the columns is editable too.
How many rows can each column have?
You choose. Pick fewer rows for wide writing space or more rows for a longer list. The ruling adjusts to fill the column evenly.
Is there an answer key?
No. The T-chart is a blank organiser for pupils to complete, so there is nothing to mark automatically. It prints ready to write on.
Related tools
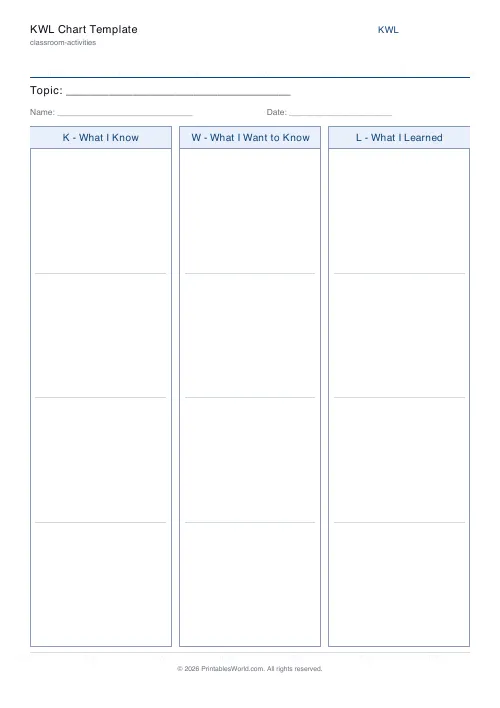
KWL Chart Template
Three-column "Know, Want to Know, Learned" graphic organiser, fillable and printable.
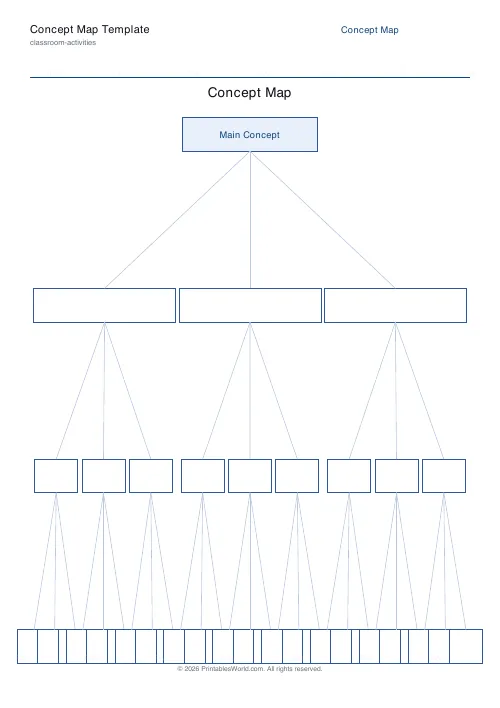
Concept Map Template
Root concept with hierarchical linked boxes in a tidy tree layout.
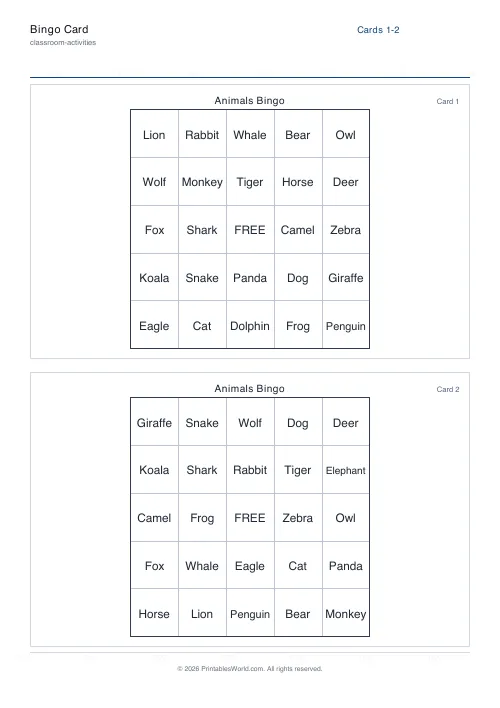
Bingo Card Generator
Generate unique printable bingo cards with custom words, FREE centre toggle, call sheet, and seeded shuffles.
Coloring Page Maker
Create printable coloring pages with mandala, geometric, and animal templates in any line thickness.
Further reading
Classroom Activities
Positive reinforcement in the classroom: charts that work
Reward charts work when they name a specific behaviour and fade over time. They backfire when they rank children publicly. Here is the difference in practice.
5 min read
Classroom Activities
Back-to-school printables every teacher needs
Sorted by when you will actually need them: the two things to print before the children arrive, the week-one set, and the routines worth establishing while everyone is still compliant.
5 min read
Classroom Activities
20 classroom games that need zero prep
Games organised by the gap they fill: two minutes at the end of a lesson, ten minutes before assembly, or a whole wet lunchtime. Almost all need nothing but a voice.
6 min read