What this tool does
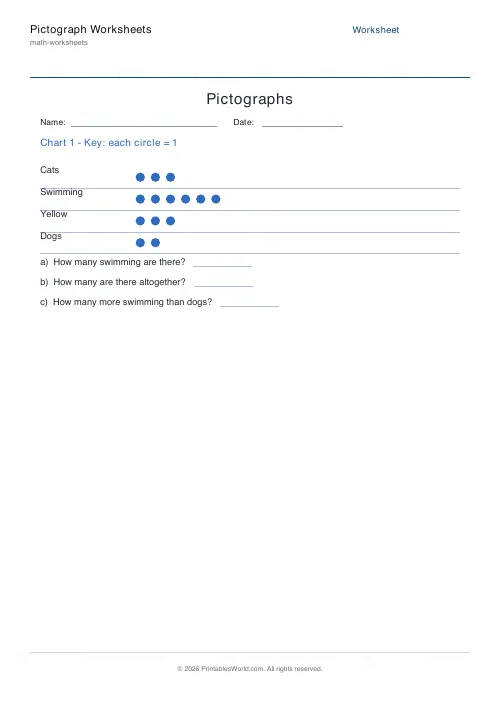
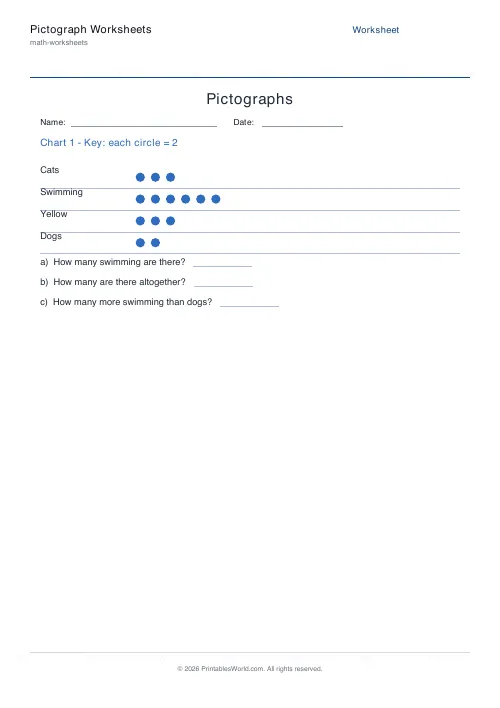
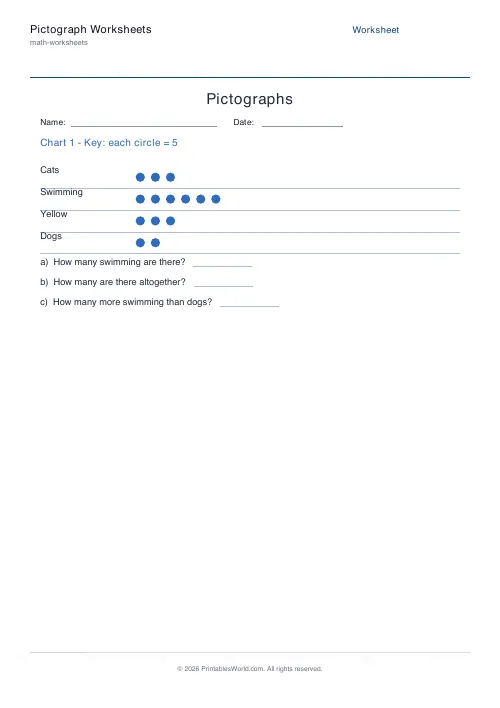
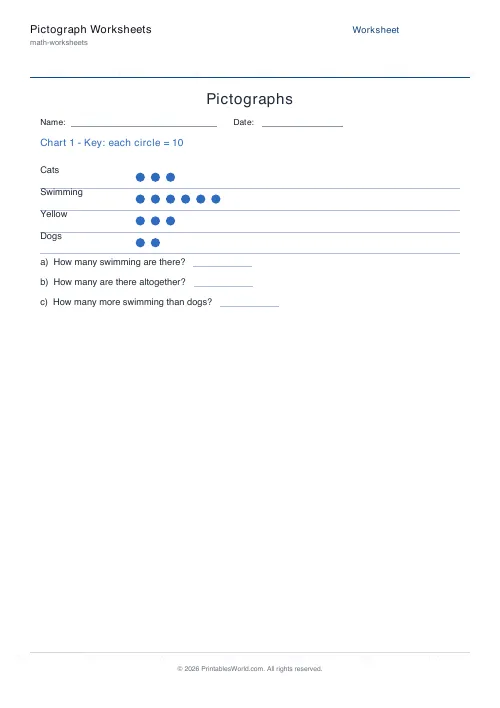
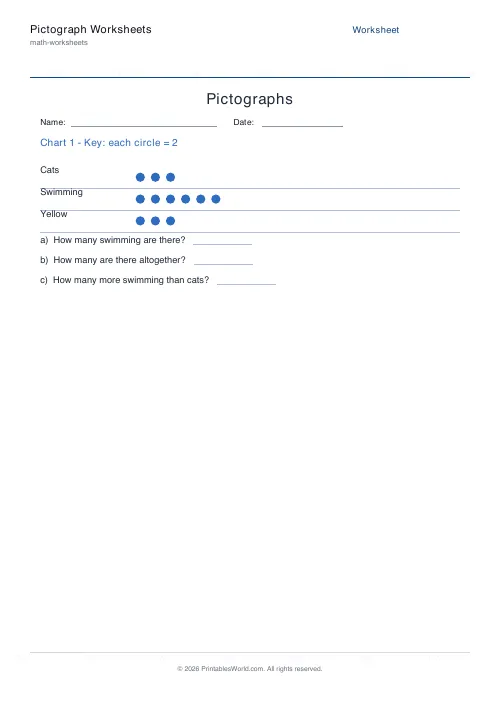
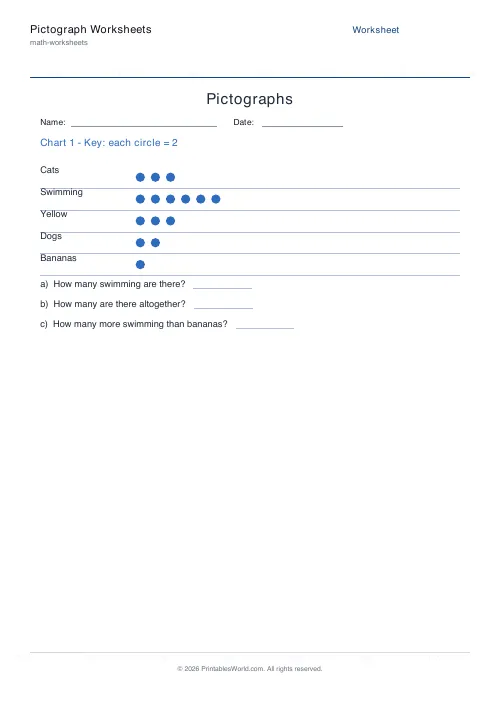
Printable pictograph worksheets. Each chart shows three to five categories as rows of repeated symbols, with a key saying what one symbol is worth. Three questions follow every chart: the total for the biggest category, the total across all of them, and the gap between the biggest and the smallest. Symbol values of 1, 2, 5 or 10, up to eight charts a sheet, and an answer key.
People also used
Feedback
Spotted something off with this tool?
Rows of symbols, and a key that changes everything
A pictograph shows data as repeated pictures, and a key states what one picture is worth. Five symbols, key of 2, answer ten.
Each chart here carries three to five categories, four unless you change it, with between one and ten symbols in a row. Then three questions: how many of the largest category there are, how many there are altogether, and how many more the largest has than the smallest. Those three cover reading a single value, summing across the chart, and comparing two of them, which is the whole skill at this level.
Up to eight charts fit on a sheet. Three is the default and is about right for a lesson.
Almost every mistake is a key mistake
Children count the symbols and report the count. Four icons, answer four. The key made it twenty.
It is not carelessness. The symbols are the visually dominant thing on the page and the key is a line of small text above them, so the eye does exactly what you would expect it to do. The fix is procedural rather than conceptual: make reading the key aloud the first move, every single time, before any question is looked at. One picture equals five, said out loud, prevents more errors than any amount of marking afterwards.
Start on a key of 1 so the count and the answer are the same number and nothing can go wrong. Then move to 2, then 5, then 10, and watch which children carry the habit across.
What a key of 5 cannot draw
Symbols here are whole. No halves, no quarters, which means a chart can only ever display a multiple of its own key and there is nothing you can do about it from the settings.
That is a limitation and it is also the best stretch question on the topic. With a key of 5, ask which totals between 1 and 30 can be shown and which cannot. Twenty works. Twenty-three does not, and no arrangement of whole symbols will make it. A child who can explain why has understood multiplication and the key at the same time, and the format's constraint has done the teaching.
Why bother, when a bar chart is more precise
Because precision is not the job.
It has no axis to interpret, which removes an entire layer of difficulty for a six-year-old. It is immediately readable and children like looking at it. And there is multiplication built into every single reading, which a bar chart does not give you at all. Set against that: awkward values cannot be drawn, comparing two categories exactly means counting icons rather than glancing at a scale, and any large data set turns into a wall of pictures.
So pictographs come early in the data-handling sequence and bar charts follow. Moving on from them is progress, not the abandonment of something that was working.
Let the class choose the key
Children understand what a key is for far faster after they have picked a bad one themselves and had to live with the consequences of it.
Collect real data with a tally. How everyone travels to school, favourite fruit, how many pets. Then ask what one symbol should be worth. If the biggest count is thirty and somebody proposes a key of 1, let them start drawing thirty icons in a row and stop them at about twelve. That failure explains the purpose of a key better than any amount of telling.
Then swap charts with a partner and answer questions about theirs. Reading a pictograph you did not design, with a key you did not choose, is the thing actually being assessed.
FAQs
Quick answers
What is a pictograph?
A chart that represents data with repeated symbols. A key tells you how many each symbol stands for, so you multiply the number of symbols by the key value to get the total.
Can I change what each symbol is worth?
Yes. Set the key to 1, 2, 5, or 10. Higher values bring scaling and multiplication into the reading task.
How many questions are on each chart?
Three: the total for the largest category, the overall total, and the difference between the largest and smallest categories. The answer key shows all of them.
How many charts can I make?
As many as you need. Each chart prints on its own section, and an answer version is generated when the answer key is enabled.
Related tools
Bar Chart Reading Worksheets
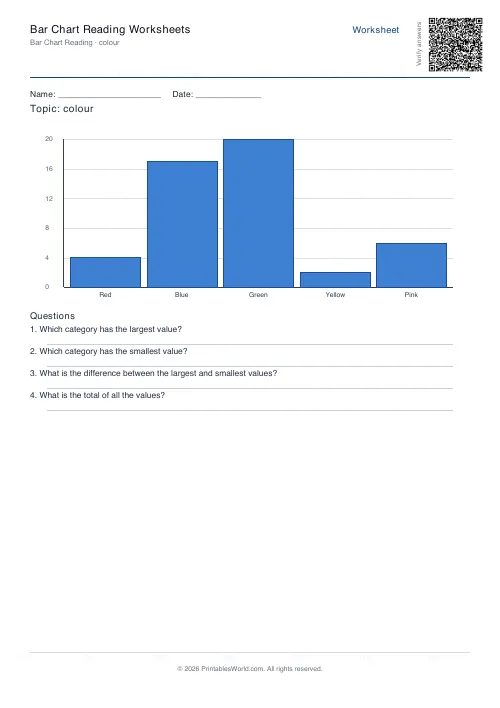
Interpret a bar chart and answer comprehension questions about the data.
Tally Chart Worksheets
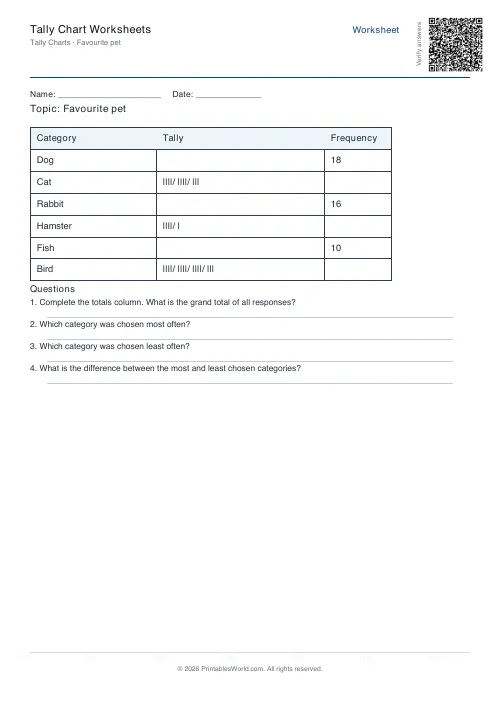
Complete a tally chart and frequency table, then answer questions about the data.
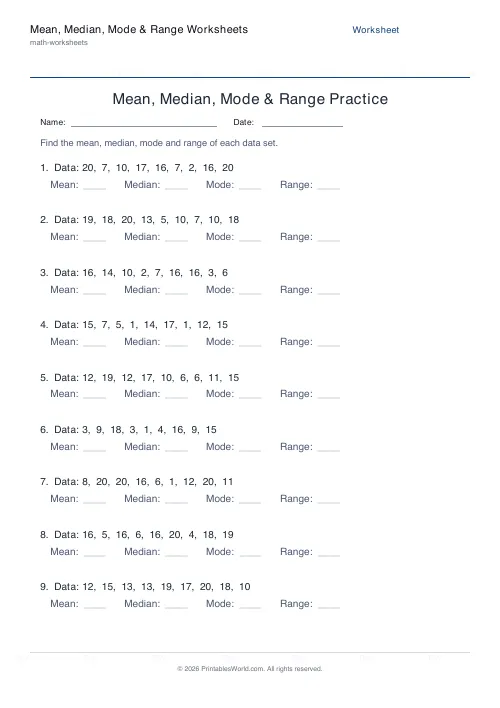
Mean: Median, Mode & Range Worksheets
Calculate averages from data sets on printable sheets.
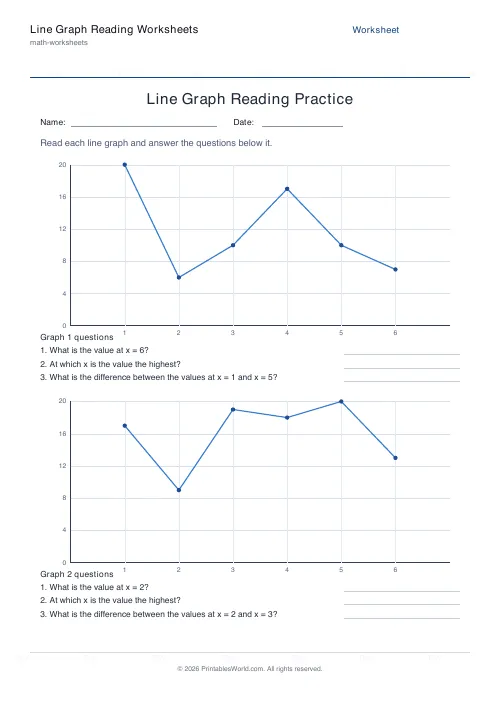
Line Graph Reading Worksheets
Read values, peaks and differences off a line graph.
Further reading
More like this
 Addition Worksheets Generator
 Visual Addition Worksheets Generator
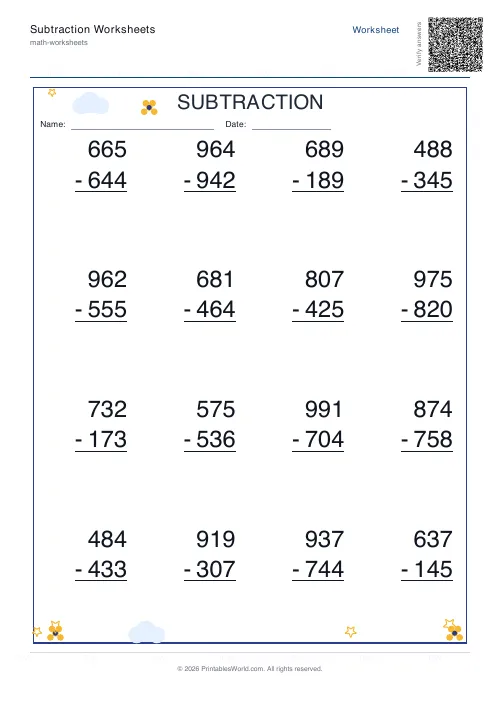 Subtraction Worksheets Generator
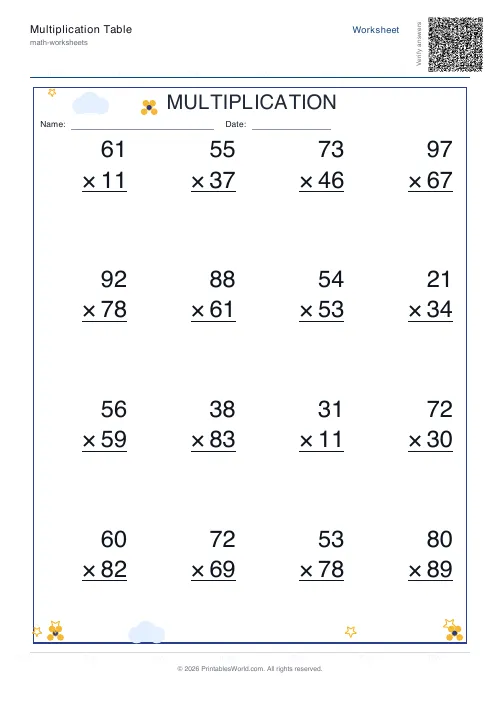 Multiplication Table Generator
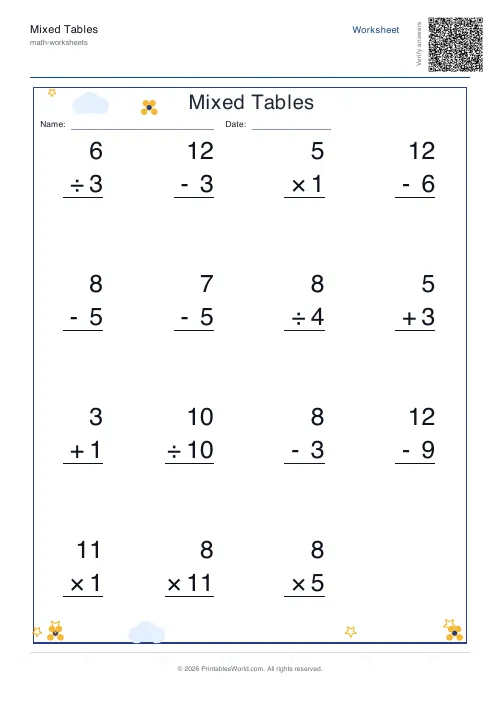 Mixed Tables Generator
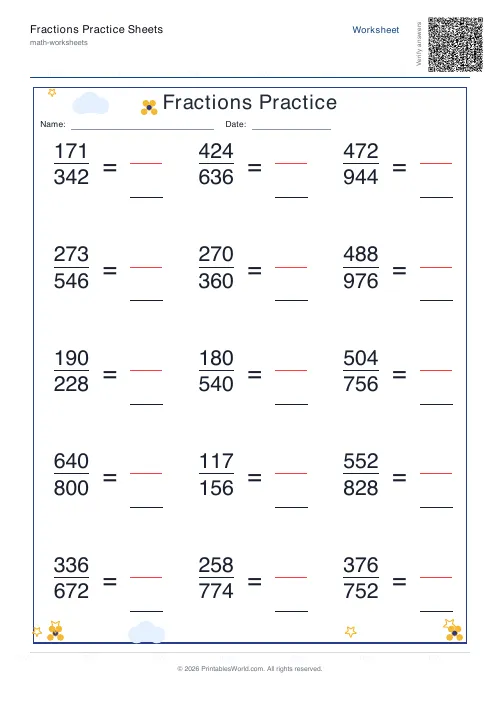 Fractions Practice Sheets Generator
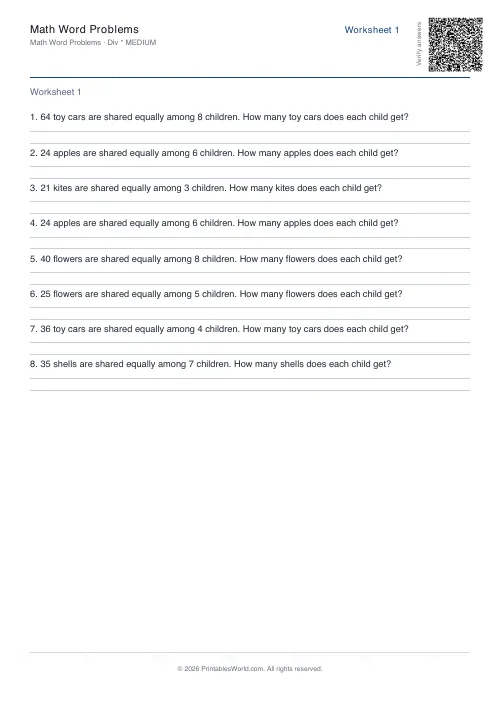 Math Word Problems Generator
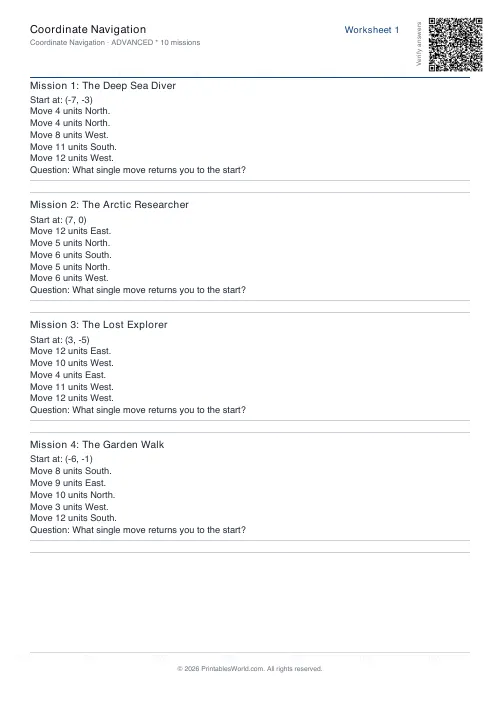 Coordinate Navigation Generator
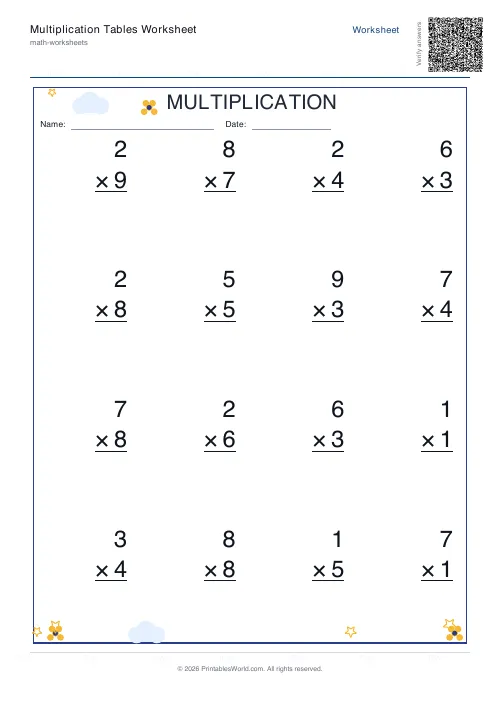 Multiplication Tables Worksheet
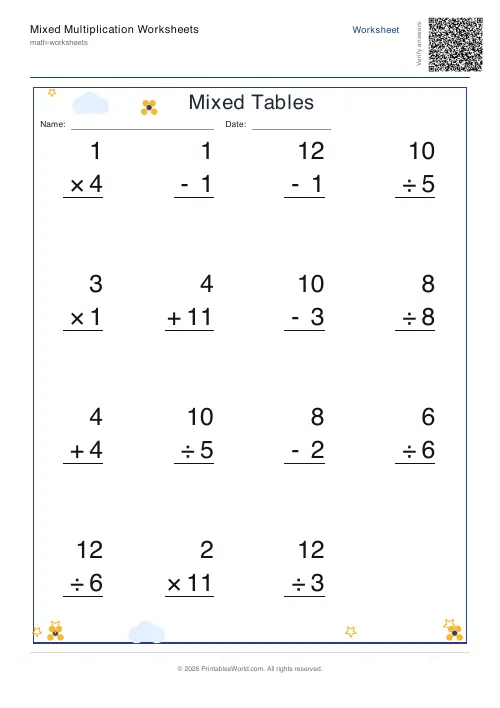 Mixed Multiplication Worksheets
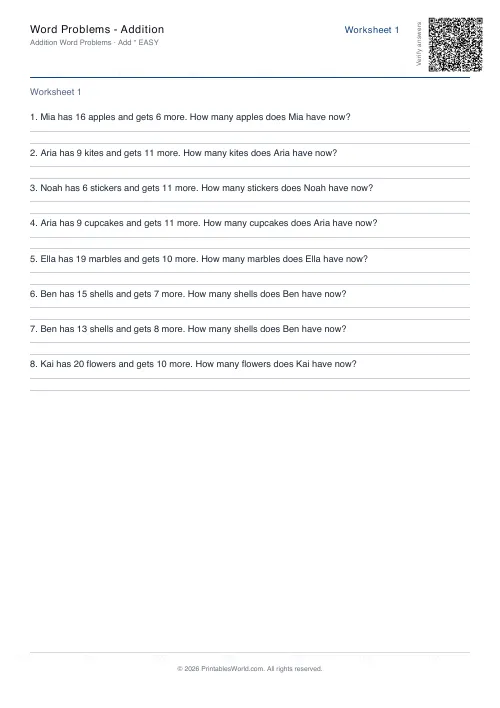 Word Problems: Addition
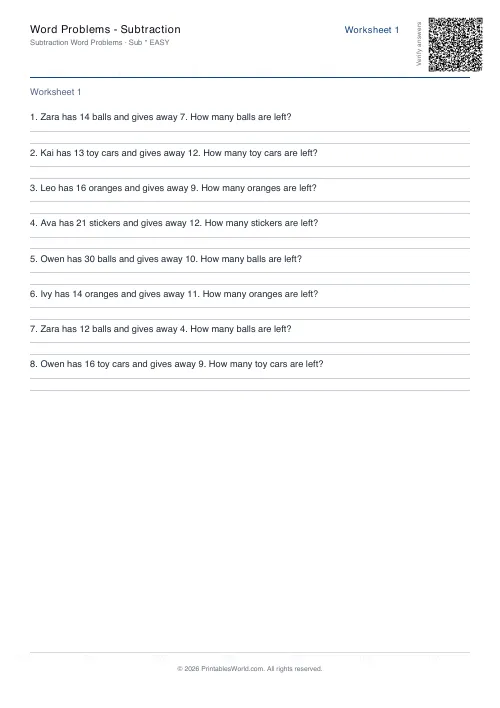 Word Problems: Subtraction
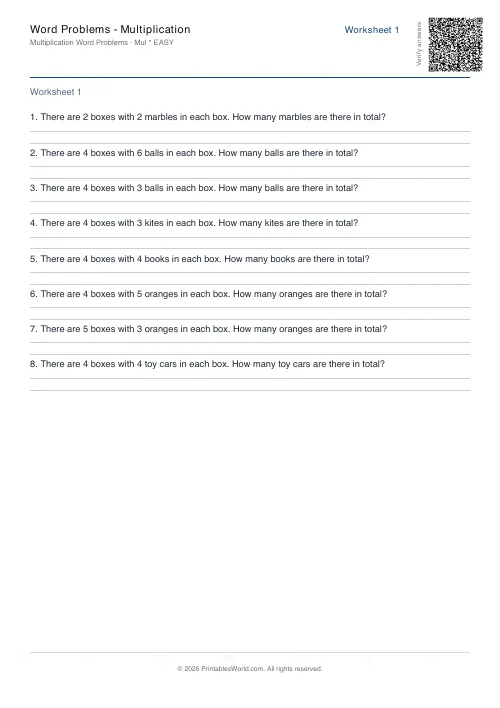 Word Problems: Multiplication
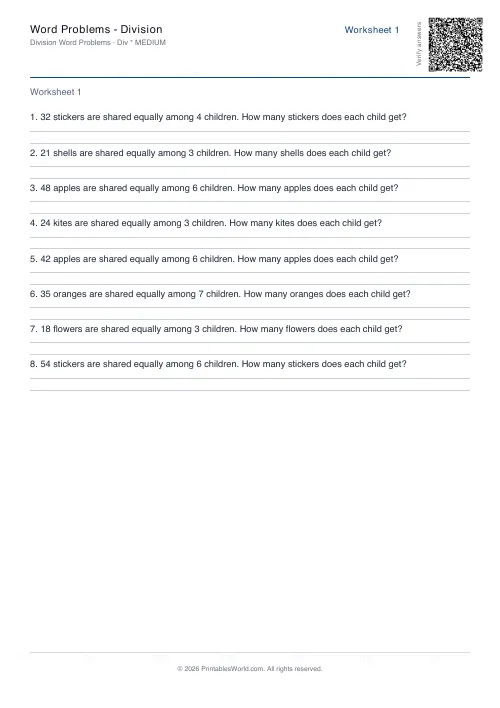 Word Problems: Division