Math Worksheets
Bar Chart Reading Worksheets
Interpret a bar chart and answer comprehension questions about the data.
Last updated:
What this tool does
Create printable bar chart comprehension worksheets. The generator produces a labelled bar chart from a random dataset on your topic, then asks reading questions about largest, smallest, totals, and differences.
Free downloads
Ready-made Bar Chart Reading Worksheet printables — free PDF downloads
No setup needed — download these print-ready bar chart reading worksheets as free PDFs. Each one was made with the generator above, so you can recreate or fully customize any of them.
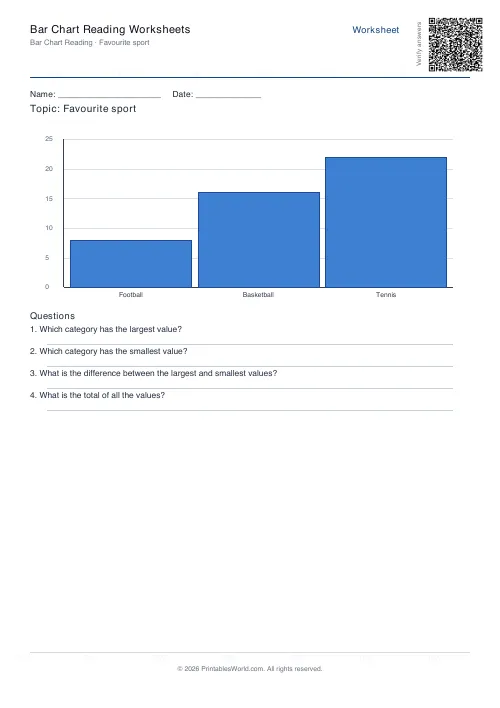
Bar Chart Reading Worksheet — 3 bars
Print-ready bar chart reading worksheet (3 bars) as a free PDF — made with the generator above so you can tweak and reprint.
↓ Download PDF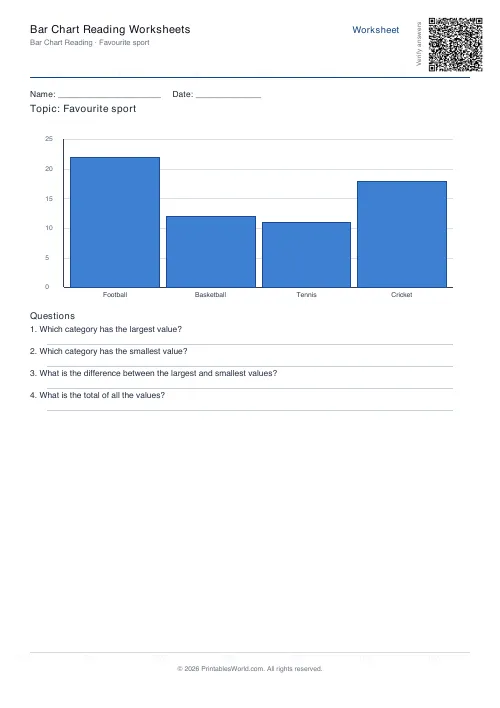
Bar Chart Reading Worksheet — 4 bars
Print-ready bar chart reading worksheet (4 bars) as a free PDF — made with the generator above so you can tweak and reprint.
↓ Download PDF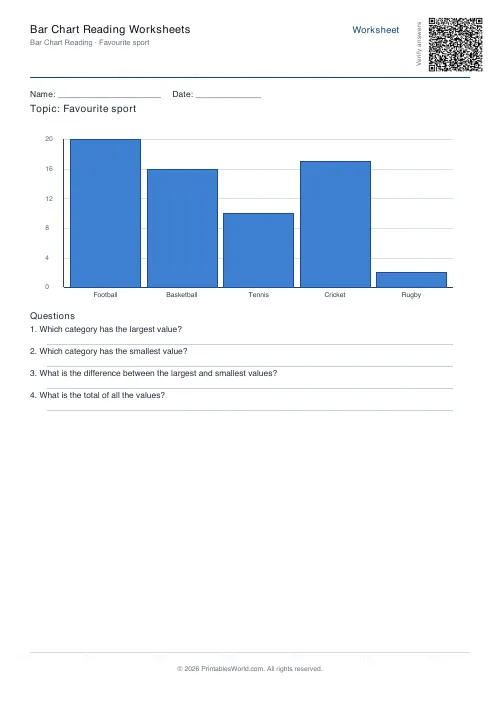
Bar Chart Reading Worksheet — 5 bars
Print-ready bar chart reading worksheet (5 bars) as a free PDF — made with the generator above so you can tweak and reprint.
↓ Download PDF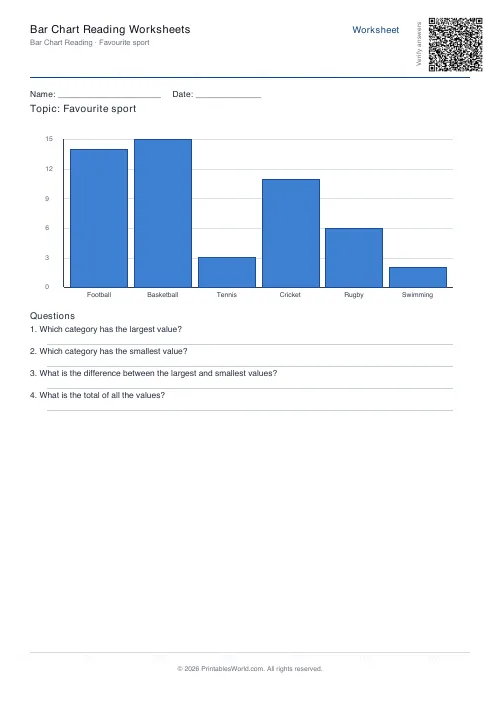
Bar Chart Reading Worksheet — 6 bars
Print-ready bar chart reading worksheet (6 bars) as a free PDF — made with the generator above so you can tweak and reprint.
↓ Download PDF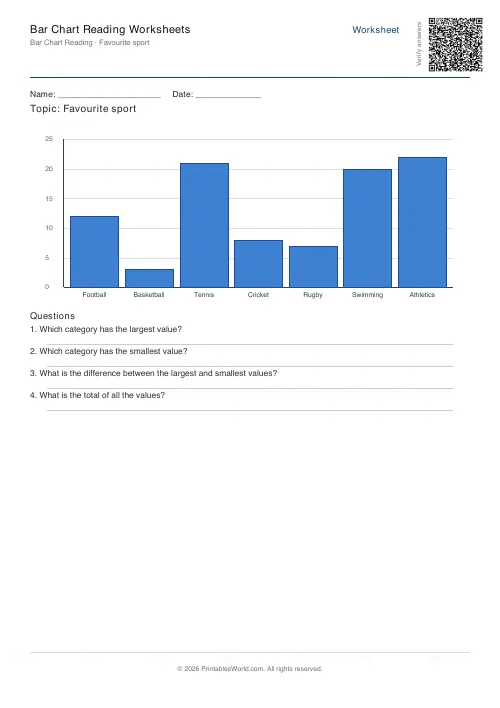
Bar Chart Reading Worksheet — 7 bars
Print-ready bar chart reading worksheet (7 bars) as a free PDF — made with the generator above so you can tweak and reprint.
↓ Download PDF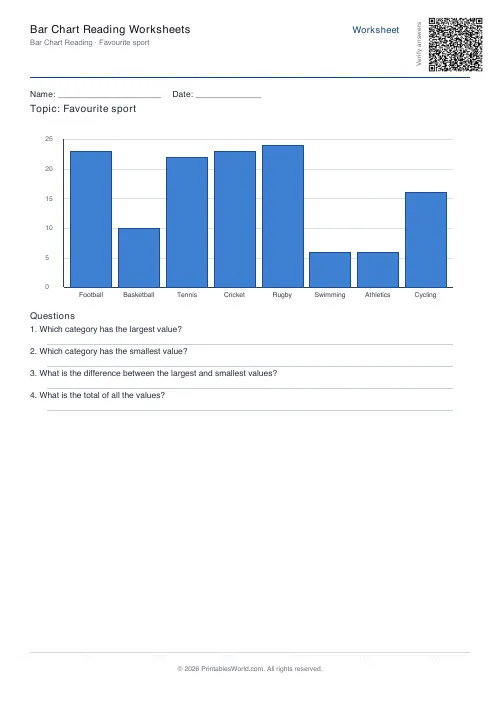
Bar Chart Reading Worksheet — 8 bars
Print-ready bar chart reading worksheet (8 bars) as a free PDF — made with the generator above so you can tweak and reprint.
↓ Download PDF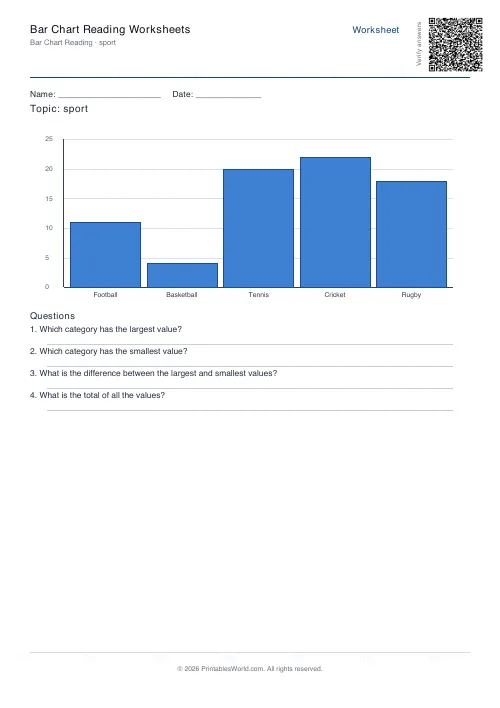
Bar Chart Reading Worksheet — Sport
Print-ready bar chart reading worksheet (Sport) as a free PDF — made with the generator above so you can tweak and reprint.
↓ Download PDF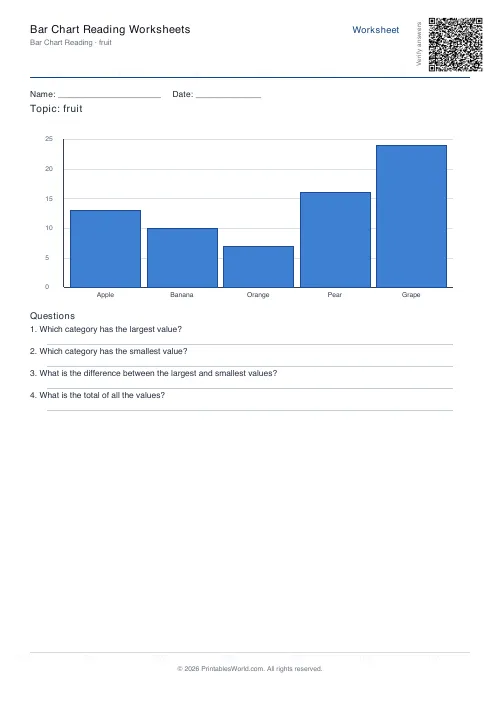
Bar Chart Reading Worksheet — Fruit
Print-ready bar chart reading worksheet (Fruit) as a free PDF — made with the generator above so you can tweak and reprint.
↓ Download PDF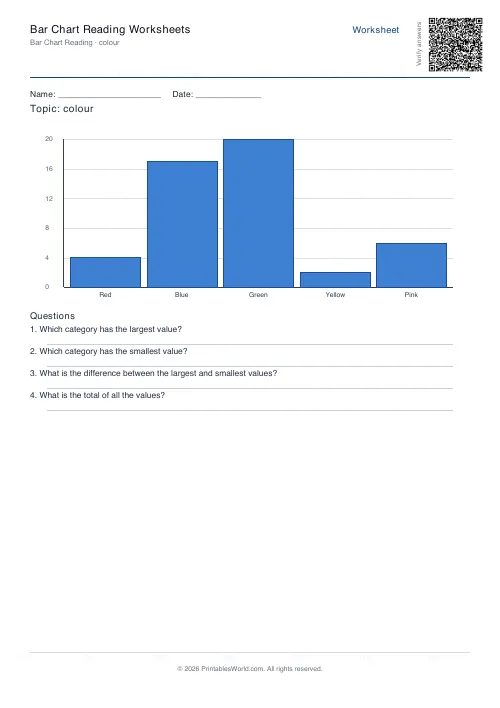
Bar Chart Reading Worksheet — Colour
Print-ready bar chart reading worksheet (Colour) as a free PDF — made with the generator above so you can tweak and reprint.
↓ Download PDF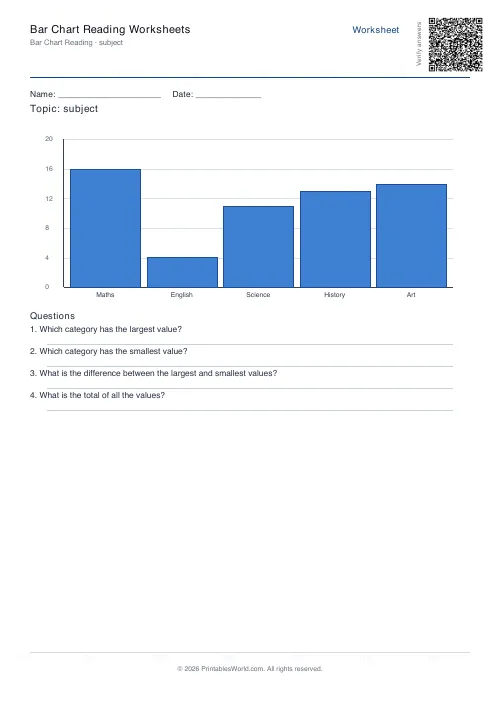
Bar Chart Reading Worksheet — Subject
Print-ready bar chart reading worksheet (Subject) as a free PDF — made with the generator above so you can tweak and reprint.
↓ Download PDF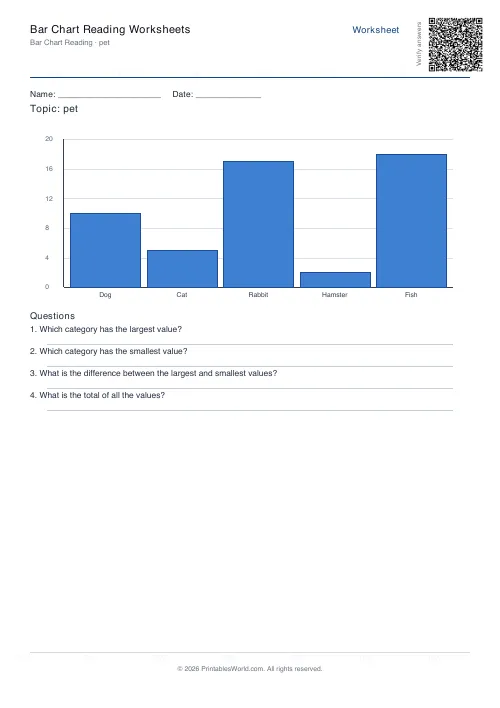
Bar Chart Reading Worksheet — Pet
Print-ready bar chart reading worksheet (Pet) as a free PDF — made with the generator above so you can tweak and reprint.
↓ Download PDF
Bar Chart Reading Worksheet — 3 questions
Print-ready bar chart reading worksheet (3 questions) as a free PDF — made with the generator above so you can tweak and reprint.
↓ Download PDF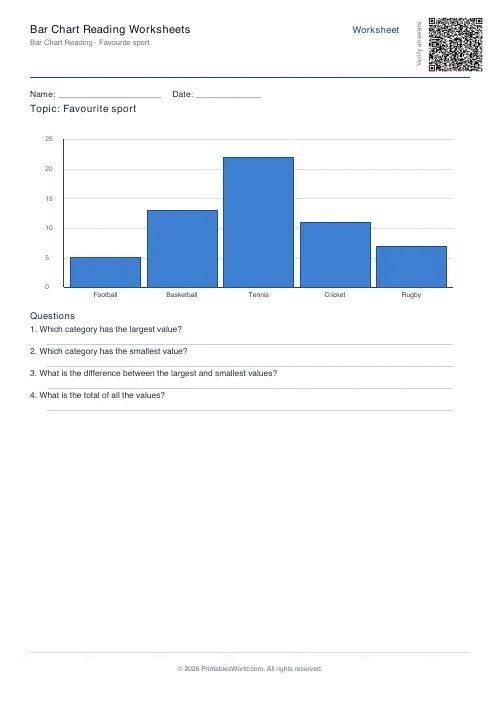
Bar Chart Reading Worksheet — 4 questions
Print-ready bar chart reading worksheet (4 questions) as a free PDF — made with the generator above so you can tweak and reprint.
↓ Download PDF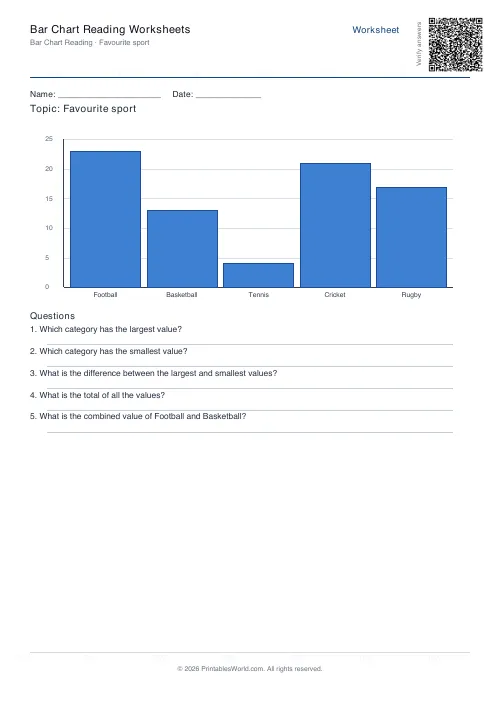
Bar Chart Reading Worksheet — 5 questions
Print-ready bar chart reading worksheet (5 questions) as a free PDF — made with the generator above so you can tweak and reprint.
↓ Download PDF
Settings
Customize your bar chart worksheet
5 bars · 4 questions · A4
Paper size
Preview
Live PDF preview
The actual PDF, updated as you change settings.
People also used
Pie Chart Reading Worksheets
Interpret a pie chart with percentages and answer comprehension questions.
Tally Chart Worksheets
Complete a tally chart and frequency table, then answer questions about the data.
Probability Basics Worksheets
Simple probability problems with coins, dice, and spinners — answer as a fraction, decimal, or percent.
Feedback
Spotted something off with this tool?
Create Printable Bar Chart Reading Worksheets for Data Handling Practice
Generate free printable bar chart worksheets where a fully-drawn chart is paired with reading-comprehension questions about the data.
Create worksheets in A4 or US Letter PDF format for primary data handling lessons, homework, and revision. Each worksheet includes a labelled bar chart with gridlines and axis values, plus up to six questions about the largest category, the smallest, totals, and differences between bars.
This bar chart reading generator helps parents, teachers, homeschoolers, and tutors produce genuine chart-interpretation practice quickly, without hunting through textbook pages for a dataset that happens to fit the lesson.
Why use this bar chart reading generator?
Data handling is a core part of the primary maths curriculum, but good printable practice is hard to find. This generator draws a fresh bar chart every time so learners practise interpreting real visuals rather than memorising one familiar example. Use it for:
- statistics and data-handling units
- classroom starter tasks
- homework and revision sheets
- SATs-style comprehension practice
- tutor sessions on reading graphs
- homeschool topic work linked to science or PE surveys
Because the dataset is randomised on every export, you can generate a dozen worksheets on the same topic for different pupils.
What you can customise
The generator gives you direct control over the dataset and the chart:
- Topic: Enter a theme such as "favourite fruit" or "minutes of sport played" to shape the category labels
- Number of categories: Between 3 and 8 bars
- Value range: Sets the size of the bars and the y-axis scale
- Question count: Up to six comprehension questions per sheet
- Include answer key: Appends a full answers page with every value and question solution
- Worksheet title, name and date fields
- Paper size: A4 or US Letter PDF
The bar chart is drawn directly in the PDF with axis labels and gridlines, so it prints cleanly without requiring any images.
Notes and limitations
- The dataset is regenerated each time, so downloading twice will give different numbers and slightly different questions.
- Category labels are chosen to suit the topic you type; very unusual topics may produce generic labels.
- All values are whole numbers to keep the arithmetic suitable for Years 2 to 6.
- For best readability, keep the category count at 5 or 6 on A4; 8 bars print more tightly.
Who these worksheets are for
Bar chart reading is a standard skill across primary and lower secondary maths, so this generator suits a wide range of users.
Parents
Use printable bar chart worksheets to support reading, totalling, and comparing skills at home without needing extra textbook materials.
Teachers
Produce differentiated comprehension tasks for the whole class, or use the same topic at different scales for ability groups.
Homeschool families
Link a maths lesson to a real survey (favourite meals, weather observations, pet counts) by generating a matching bar chart worksheet.
Tutors
Quickly build SATs-style or Key Stage 2 revision questions on reading and interpreting charts.
Worksheet style options
Standard comprehension set
The default mix includes a "largest category" question, a "smallest category" question, a total, and one or two difference or combined questions. This mirrors the style of questions used in UK Key Stage 2 data handling.
Larger datasets
Using 7 or 8 categories makes the reading harder because pupils have to track more bars. It is useful for older learners or as a stretch task.
Answer key
When you include the answer key, the PDF lists every category with its exact value and the answer to every question, which makes marking fast.
How to use the tool
- Type a topic such as "favourite ice cream flavour" or "books read this month".
- Set how many categories you want (3 to 8).
- Choose the value range for the bars.
- Pick how many comprehension questions to include.
- Turn Include answer key on or off.
- Choose your paper type: A4 or US Letter.
- Click Generate to preview the bar chart and questions.
- Download the PDF.
Worked example
Suppose you type the topic "favourite fruit", set 5 categories, and choose a value range up to 20. The generator might draw a chart where apples = 17, bananas = 9, grapes = 14, oranges = 6 and pears = 11, with the y-axis scaled to 20 in steps of 2.
The questions then ask: which fruit was chosen by the most children (apples, 17)? Which was chosen by the fewest (oranges, 6)? How many children were surveyed in total (57)? And how many more chose apples than oranges (11)?
Methodology
The engine generates a randomised dataset that respects your category count and value range, then draws a proportional bar chart into the branded PDF. The y-axis scale is chosen to fit the largest bar with a round-number step. Questions are built from the dataset so they always have a correct numerical answer, and the answer key lists each category value for easy marking.
Helpful preset ideas
- "Favourite fruit" with 5 categories for Year 2 to Year 3
- "Minutes of reading per day" with 5 categories for Year 4
- "Books read this term" with 6 categories and a larger value range for Year 5 to Year 6
- "Goals scored" with 8 categories for stretch comprehension
Best ways to practise bar chart reading
- Start with 3 or 4 categories before moving to bigger datasets.
- Read the axis scale before answering the questions.
- Encourage learners to underline the key word in each question (most, least, total, difference).
- Swap between real survey data and generated charts so pupils see both.
Designed for A4 and US Letter Printing
This bar chart worksheet generator outputs PDFs in both A4 and US Letter, so you can print the same task at school or at home on whichever paper your printer expects. Gridlines, axis values and category labels all scale to fit the chosen paper size.
Related maths practice tools
You may also find these related data and number tools useful:
FAQs
Quick answers
Is the bar chart drawn in the PDF?
Yes. Each worksheet includes a labelled bar chart with y-axis gridlines drawn directly in the PDF.
Can I control how many categories appear?
Yes. Data points can be set from 3 to 8. The generator picks suitable labels based on the topic you provide.
What kinds of questions are asked?
Largest and smallest categories, differences between them, totals, and combined-value questions — up to six per worksheet.
Do I get an answer key?
Yes. The answers page lists each category with its value plus the answers to every question.
Related tools
Pie Chart Reading Worksheets
Interpret a pie chart with percentages and answer comprehension questions.
Tally Chart Worksheets
Complete a tally chart and frequency table, then answer questions about the data.
Probability Basics Worksheets
Simple probability problems with coins, dice, and spinners — answer as a fraction, decimal, or percent.
Coordinates Grid Worksheets
Create printable coordinate grid worksheets with 1-quadrant or 4-quadrant layouts.
Ten Frames & Hundred Chart Worksheets
Build number sense with ten frames and hundred squares.
More like this
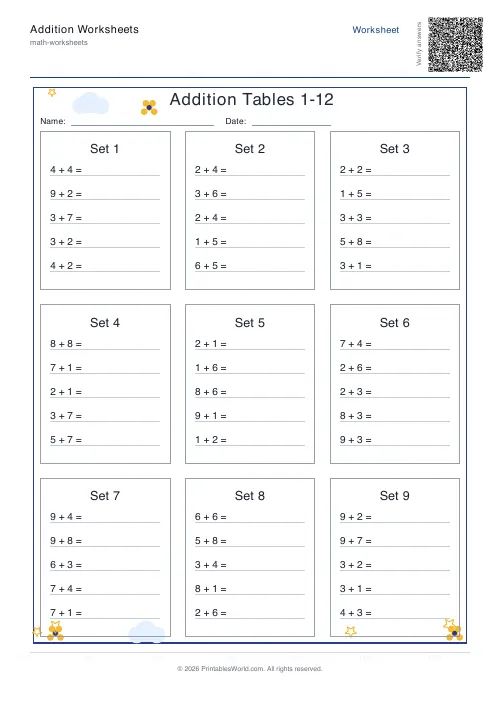 Addition Worksheets Generator
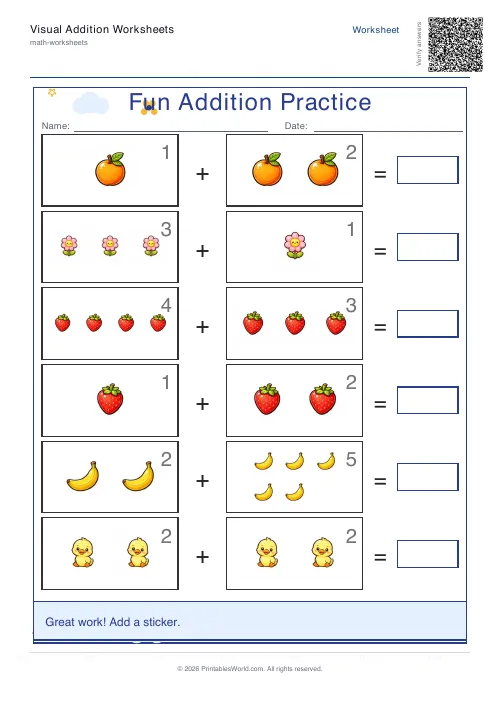 Visual Addition Worksheets Generator
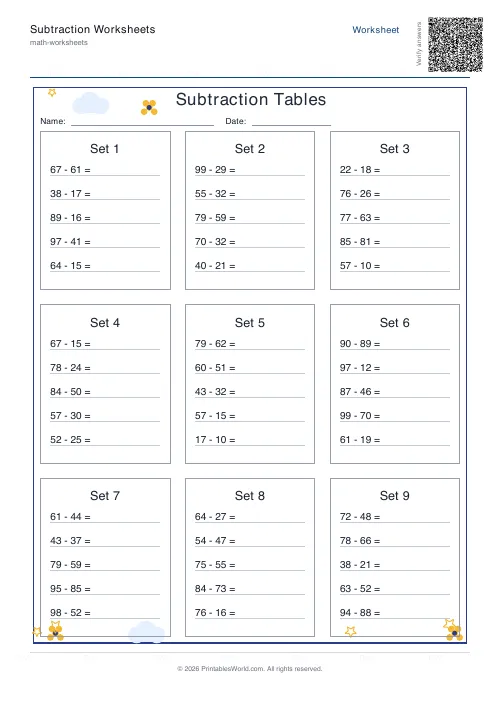 Subtraction Worksheets Generator
 Multiplication Table Generator
 Mixed Tables Generator
 Fractions Practice Sheets Generator
 Math Word Problems Generator
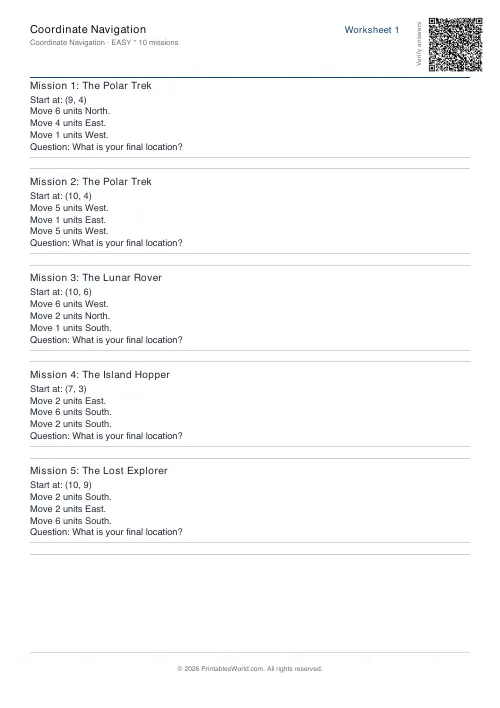 Coordinate Navigation Generator
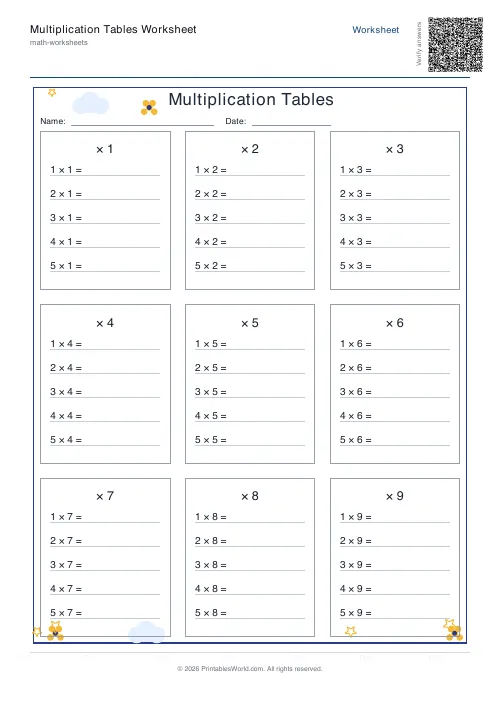 Multiplication Tables Worksheet
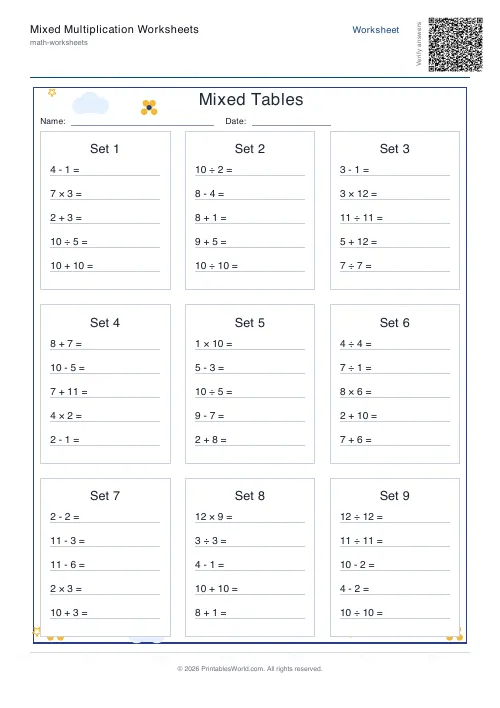 Mixed Multiplication Worksheets
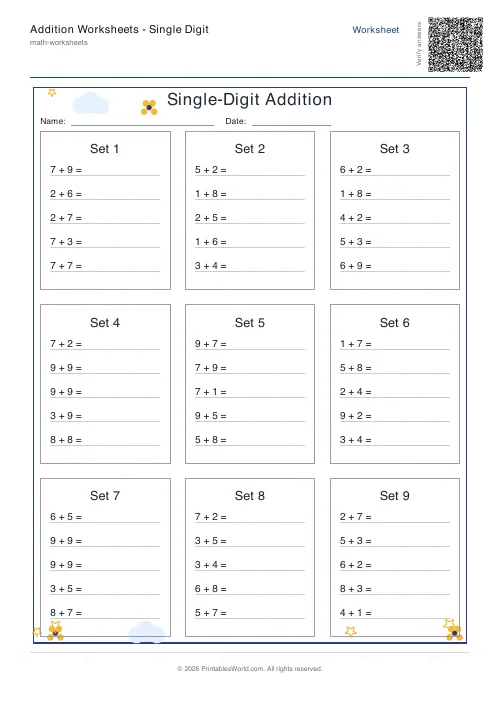 Addition Worksheets — Single Digit
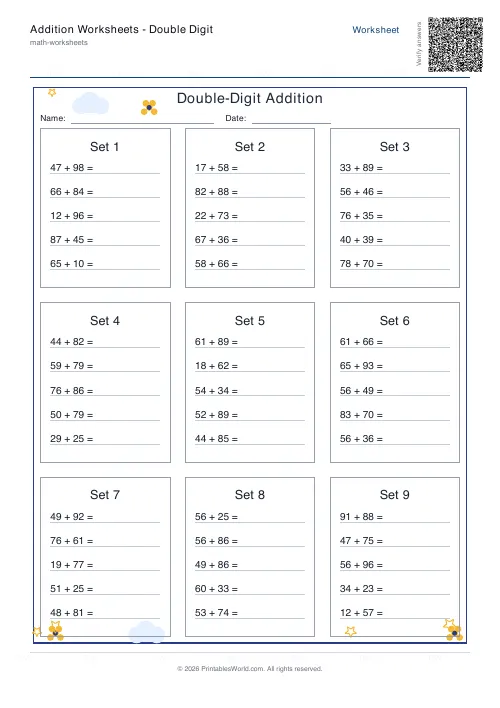 Addition Worksheets — Double Digit
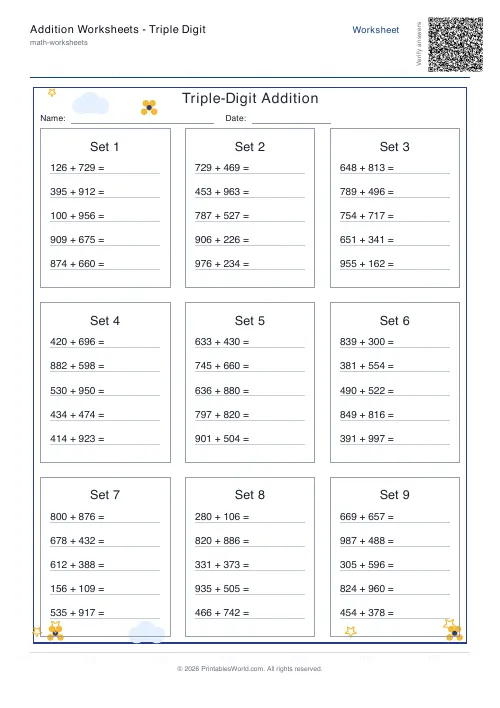 Addition Worksheets — Triple Digit
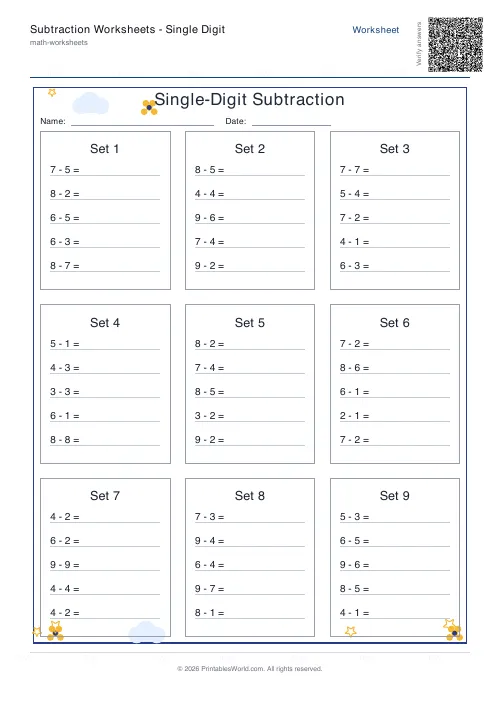 Subtraction Worksheets — Single Digit