What this tool does
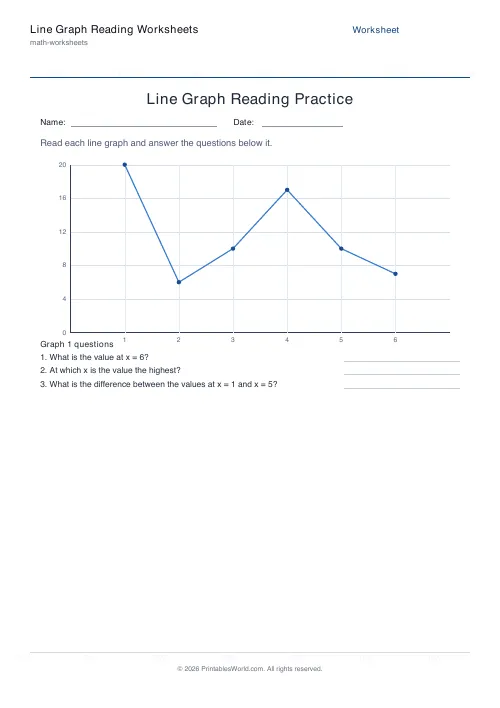
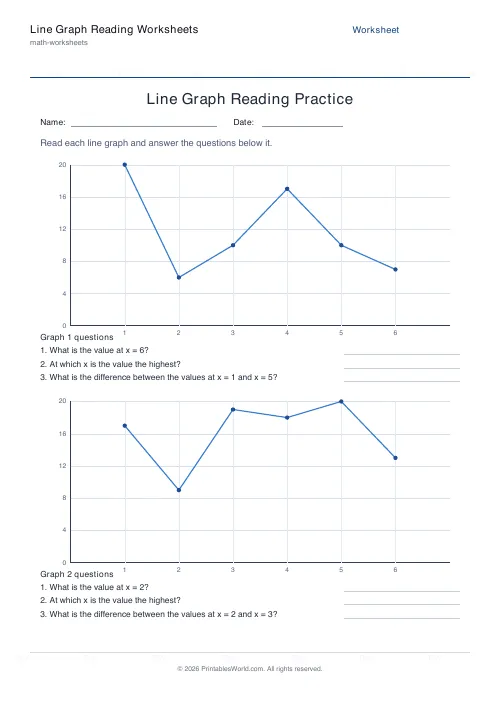
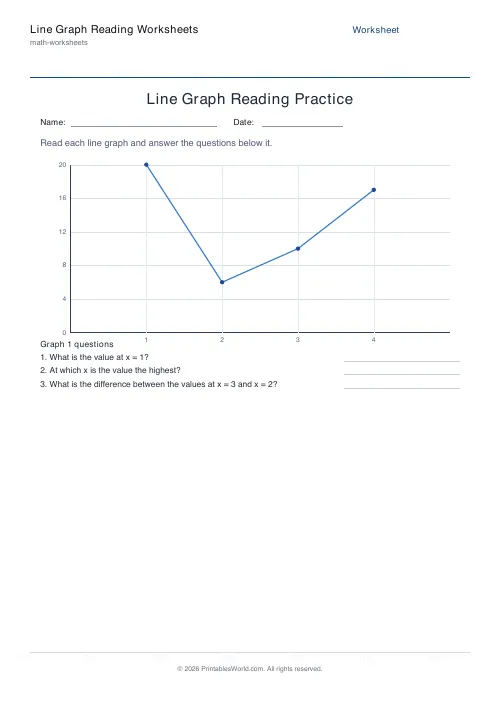
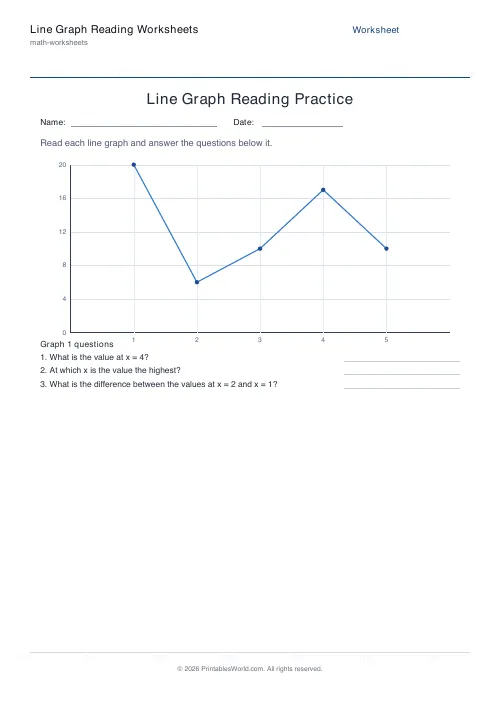
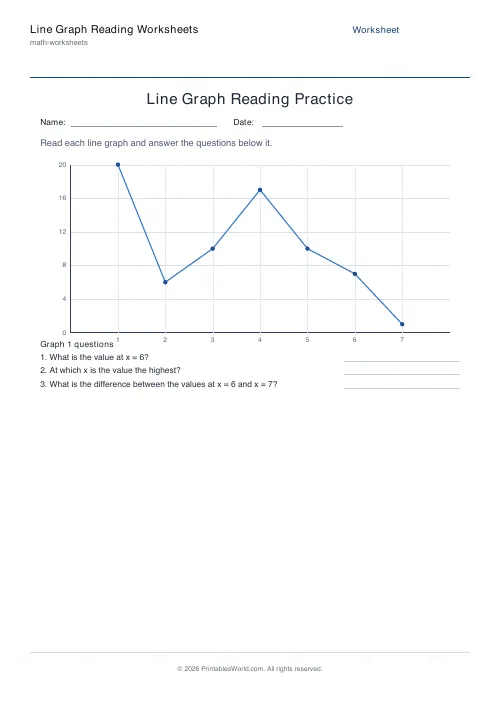
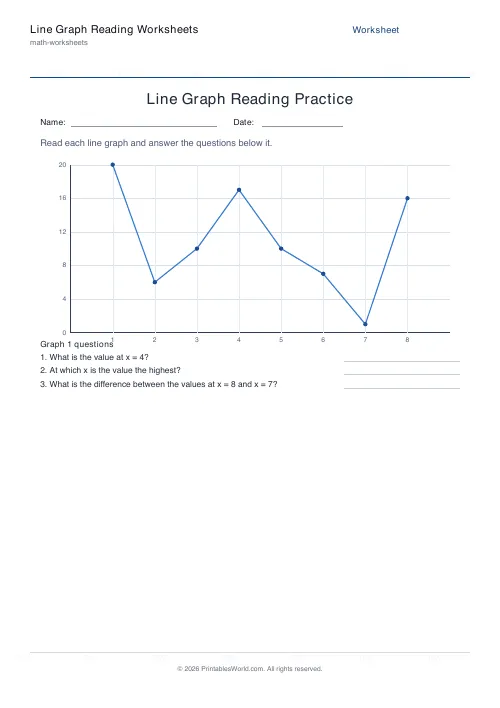
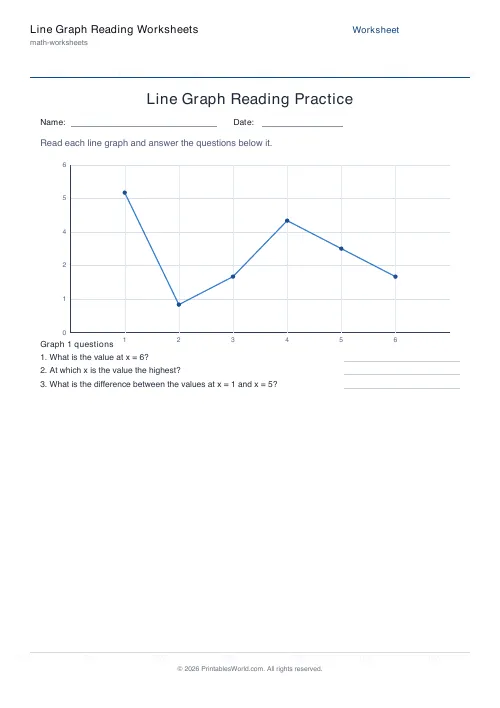
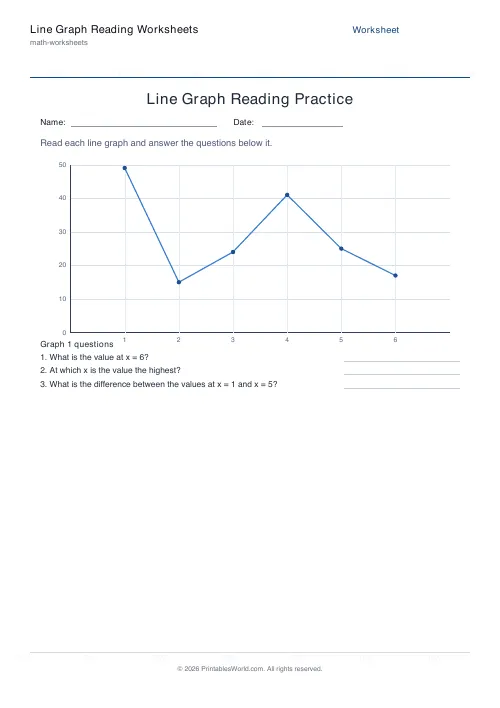
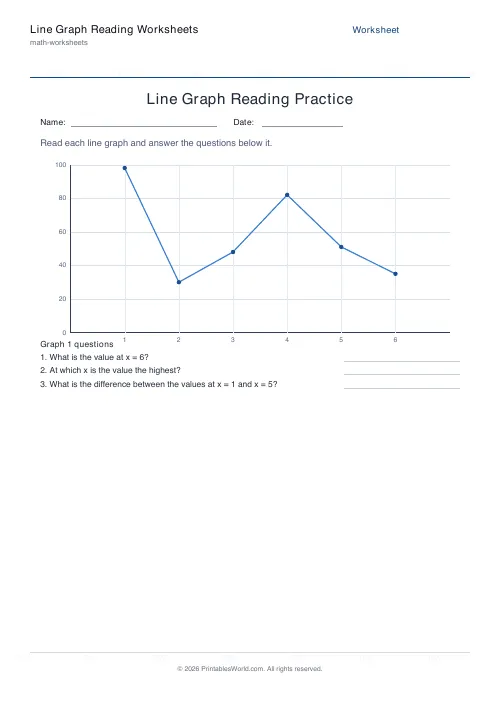
Line-graph reading worksheets. Each sheet draws a labelled graph with both axes ticked and points marked on the line, then asks three questions: read a value off the line, name the highest point, and find the difference between two points. One or two graphs a page, four to eight points on each, a y-axis maximum from 5 to 100, and an optional answer key.
People also used
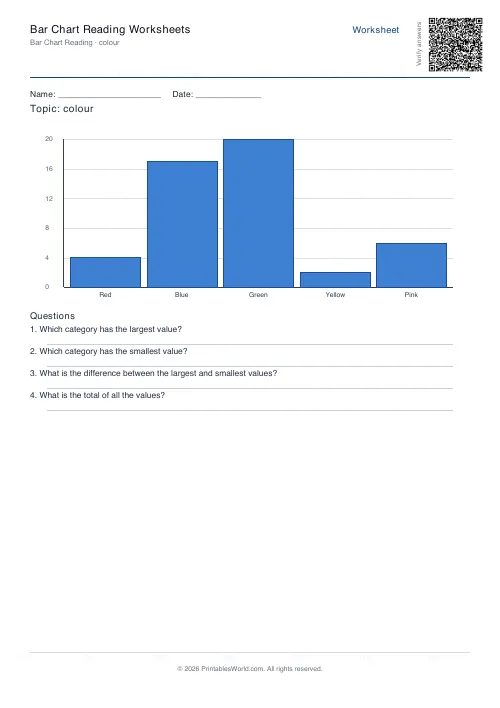
Bar Chart Reading Worksheets
Interpret a bar chart and answer comprehension questions about the data.
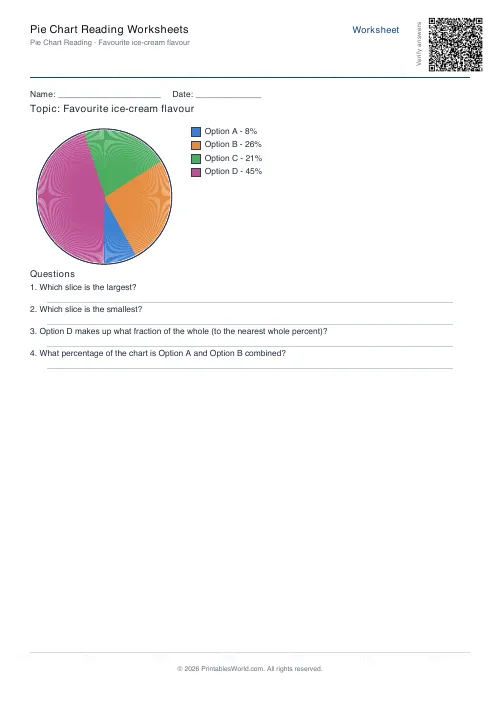
Pie Chart Reading Worksheets
Interpret a pie chart with percentages and answer comprehension questions.
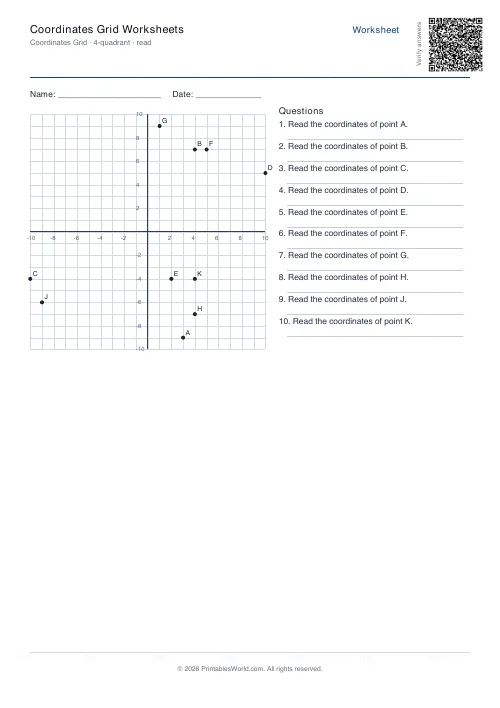
Coordinates Grid Worksheets
Create printable coordinate grid worksheets with 1-quadrant or 4-quadrant layouts.
Feedback
Spotted something off with this tool?
A graph, and three questions about it
Labelled x and y axes with tick values on both, a line joining plotted points, and small circles marking each point so a pupil can see exactly where to read from.
The three questions are always the same three, and that is deliberate. Read a value straight off the line. Identify the highest point. Work out the difference between two points. Between them they cover reading a single value, comparing values, and doing arithmetic on values, which is the whole of graph reading at this level.
One or two graphs a page. Four to eight points on each.
The finger technique
Start at the x position on the bottom axis. Move straight up until you meet the line. Then go across to the y axis and read the number.
Teach it as a physical movement with an actual finger, because the error children make is not arithmetic, it is drifting diagonally across the page and landing between two gridlines. A finger tracking up and then across cannot drift. Once the movement is automatic the reading becomes accurate, and it stays accurate on a graph with no gridlines at all.
The highest point is the tallest peak, and the useful follow-up question is where it happens rather than what it is, because that is the one that requires reading the x axis.
The y-axis maximum is the difficulty
It runs from 5 up to 100. Set it low, to 10 or 20, and the values land on clear gridlines and a child reads whole numbers straight off.
Push it to 100 and the gridlines are further apart in value, so a point sitting between two of them has to be estimated. That is a genuinely different skill and worth introducing on purpose rather than by accident: the first time a child has to answer about 65 rather than exactly 65, they need to be told that is allowed.
Point count does something similar. Four points is a simple shape. Eight is a line with a peak, a dip and a recovery in it, and questions about trend start to make sense.
Building it up
One graph, a low maximum, four points. Then more points. Then a higher scale.
Two graphs on a page opens a different question type entirely: which line rises faster, which peaks earlier, which is more consistent. None of those are on the printed sheet, and all of them are worth asking out loud once pupils have finished the three that are.
Then plot a real one. Daily temperature over a fortnight, or a bean plant measured every morning. Ask the same three questions about their own graph and the connection between the worksheet and the reason anyone draws graphs at all becomes visible.
Marking
The answer key lists the value at every plotted point as well as the worked answer to each question, so a disagreement can be traced to whichever point was misread instead of simply being marked wrong.
Press Generate New for a completely different graph at the same settings. Thirty pupils, thirty graphs, nothing to copy.
FAQs
Quick answers
How do you read a value from a line graph?
Find the x position on the bottom axis, move straight up to the line, then read across to the y axis. The number where you land on the y axis is the value at that point.
What year group is this for?
Line graphs are usually introduced around Year 4–6 (Grade 4–6). Lowering the number of points and the maximum value makes the sheets accessible to younger pupils, while more points and a higher scale extend them for older classes.
Is there an answer key?
Yes. Toggle the answer key on and the PDF adds a marked copy showing the worked answer to every question, so marking takes seconds.
Can I make every worksheet different?
Yes. Each generation plots fresh random data, so you can print a unique sheet for every pupil. Press Generate New to redraw the graph in the preview.
Related tools
Bar Chart Reading Worksheets
Interpret a bar chart and answer comprehension questions about the data.
Pie Chart Reading Worksheets
Interpret a pie chart with percentages and answer comprehension questions.
Coordinates Grid Worksheets
Create printable coordinate grid worksheets with 1-quadrant or 4-quadrant layouts.
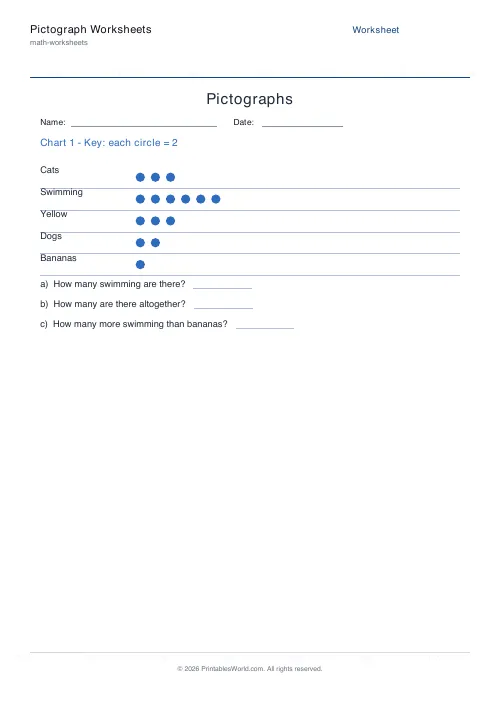
Pictograph Worksheets
Read and interpret pictographs and symbol charts.
Further reading
Math Worksheets
Addition strategies: number lines, regrouping and more
Column addition is the destination, not the route. Here are the strategies that come before it, why each matters, and how to tell which one a child is actually using.
5 min read
Math Worksheets
How to read and interpret bar charts with kids
Reading a bar chart is easy; interpreting one is not. Four questions turn a chart from something children decode into something they can reason about.
4 min read
Math Worksheets
Fractions made simple: teaching fractions at home
Fractions go wrong when the rules arrive before the meaning. Here is the order that works, the four misconceptions to head off early, and how to use everyday objects before any worksheet.
6 min read
More like this
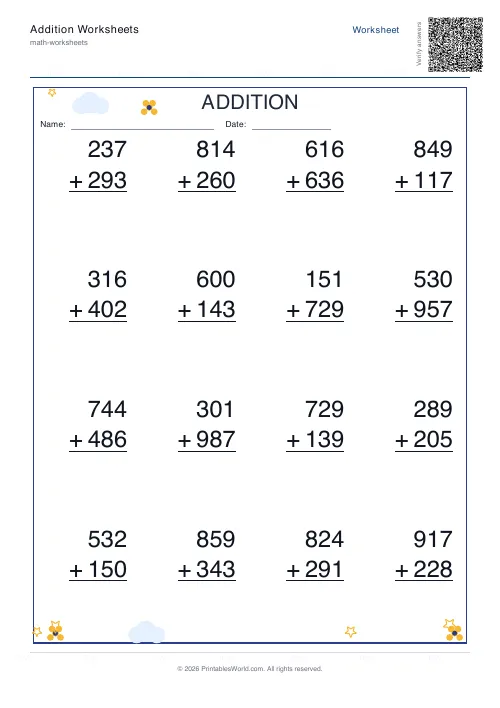 Addition Worksheets Generator
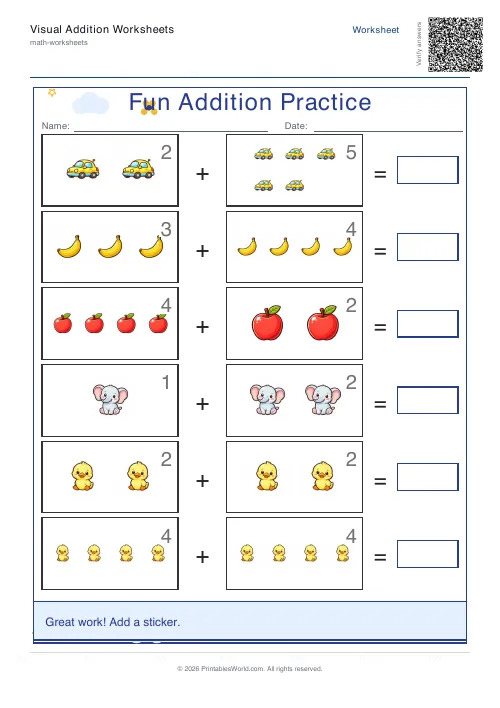 Visual Addition Worksheets Generator
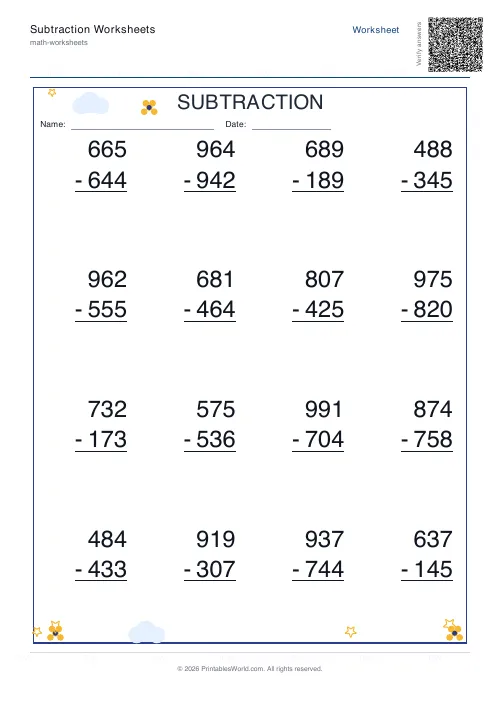 Subtraction Worksheets Generator
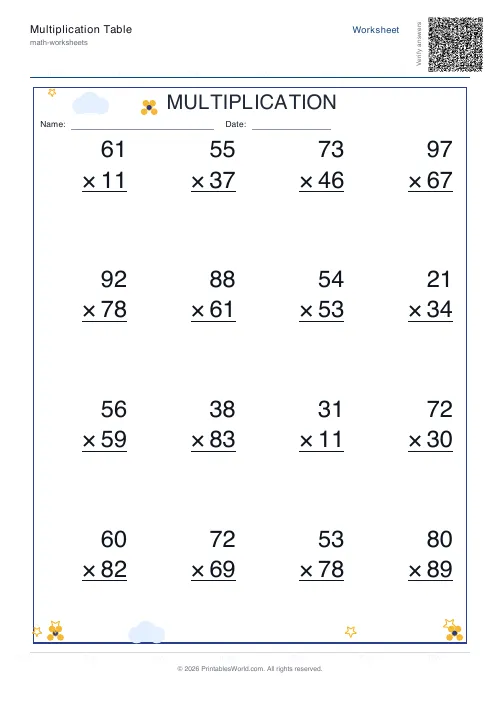 Multiplication Table Generator
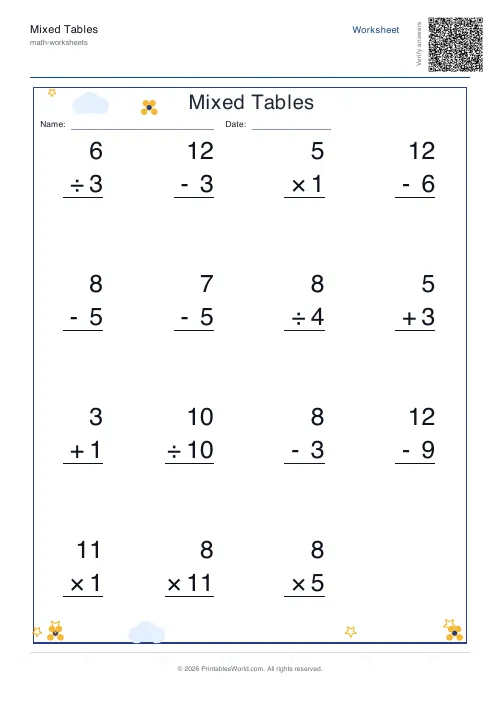 Mixed Tables Generator
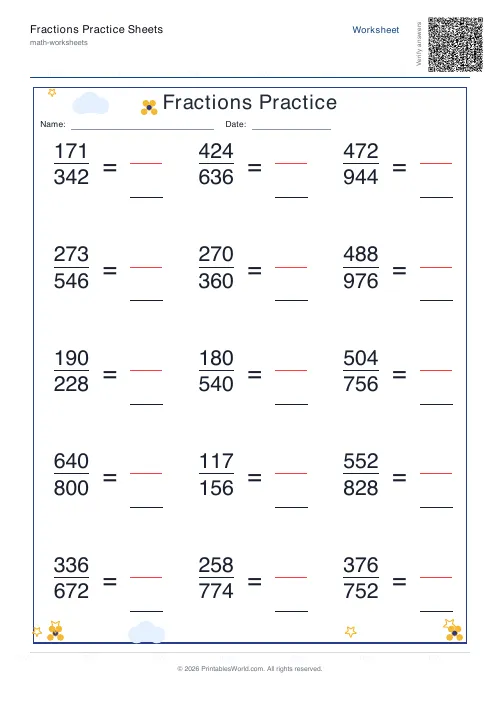 Fractions Practice Sheets Generator
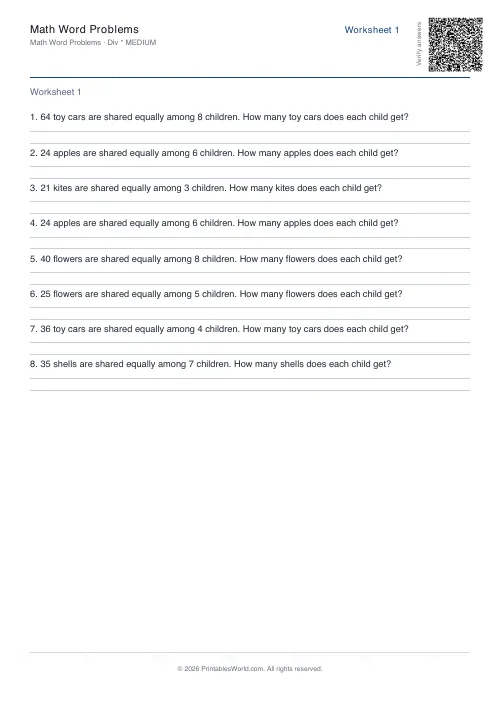 Math Word Problems Generator
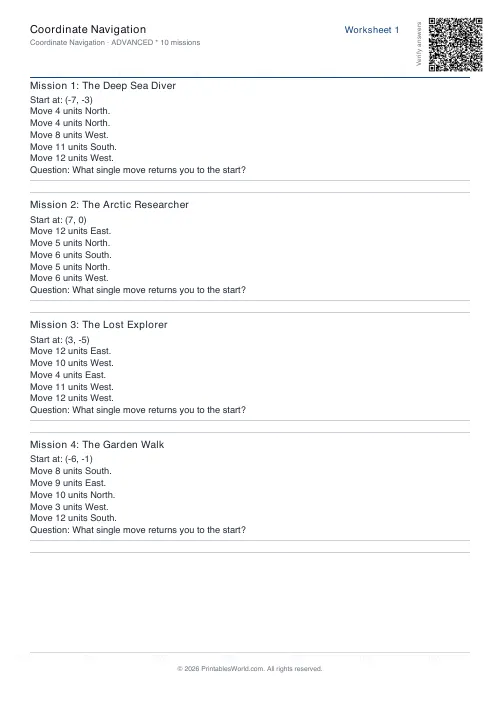 Coordinate Navigation Generator
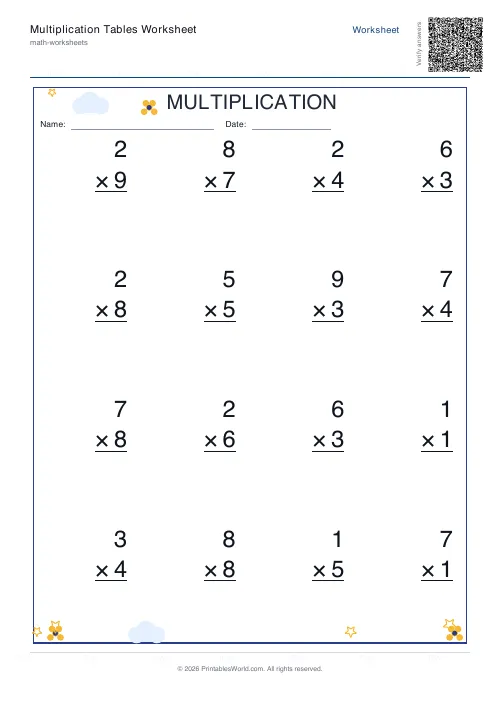 Multiplication Tables Worksheet
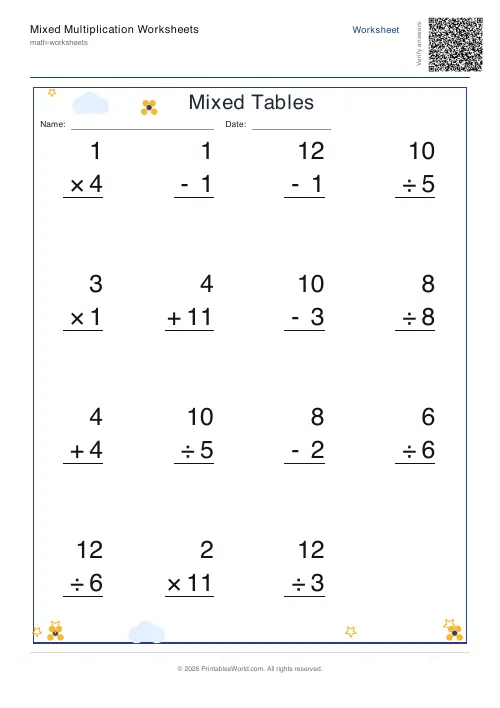 Mixed Multiplication Worksheets
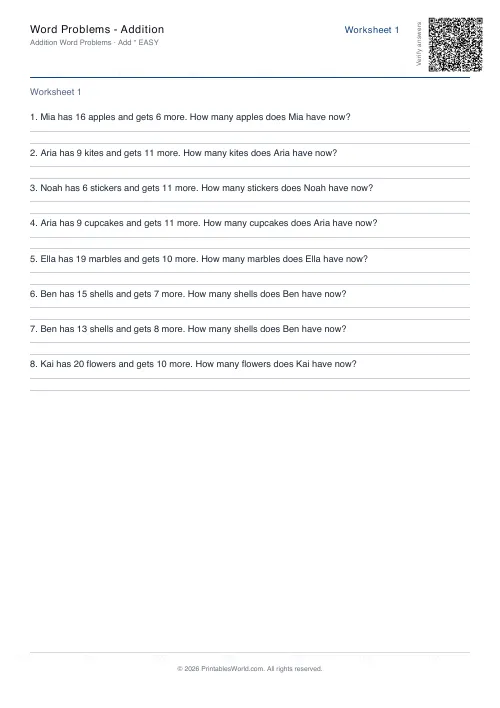 Word Problems: Addition
 Word Problems: Subtraction
 Word Problems: Multiplication
 Word Problems: Division