Math Worksheets
Tally Chart Worksheets
Complete a tally chart and frequency table, then answer questions about the data.
Last updated:
What this tool does
Create printable tally chart worksheets. The PDF builds a frequency table with categories for your topic and alternates which column is blank — sometimes the tally, sometimes the frequency — so learners practise both directions.
Free downloads
Ready-made Tally Chart Worksheet printables — free PDF downloads
No setup needed — download these print-ready tally chart worksheets as free PDFs. Each one was made with the generator above, so you can recreate or fully customize any of them.
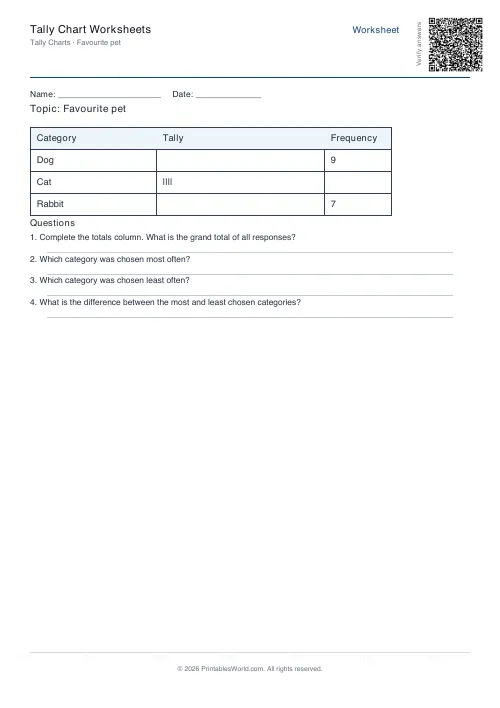
Tally Chart Worksheet — 3 categories
Print-ready tally chart worksheet (3 categories) as a free PDF — made with the generator above so you can tweak and reprint.
↓ Download PDF
Tally Chart Worksheet — 4 categories
Print-ready tally chart worksheet (4 categories) as a free PDF — made with the generator above so you can tweak and reprint.
↓ Download PDF
Tally Chart Worksheet — 5 categories
Print-ready tally chart worksheet (5 categories) as a free PDF — made with the generator above so you can tweak and reprint.
↓ Download PDF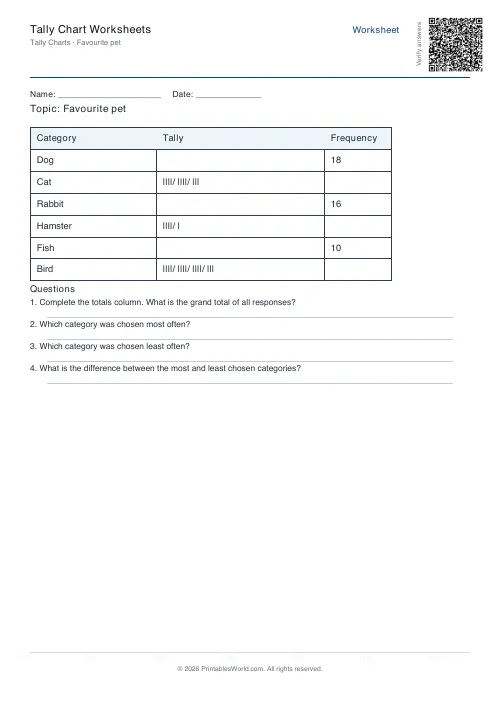
Tally Chart Worksheet — 6 categories
Print-ready tally chart worksheet (6 categories) as a free PDF — made with the generator above so you can tweak and reprint.
↓ Download PDF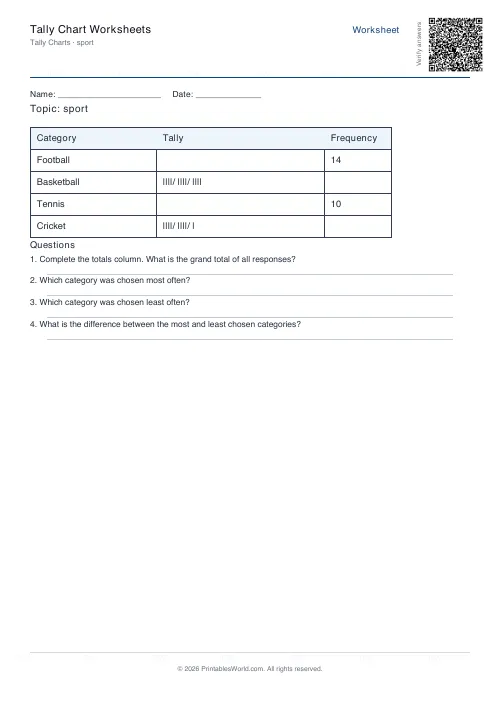
Tally Chart Worksheet — Sport
Print-ready tally chart worksheet (Sport) as a free PDF — made with the generator above so you can tweak and reprint.
↓ Download PDF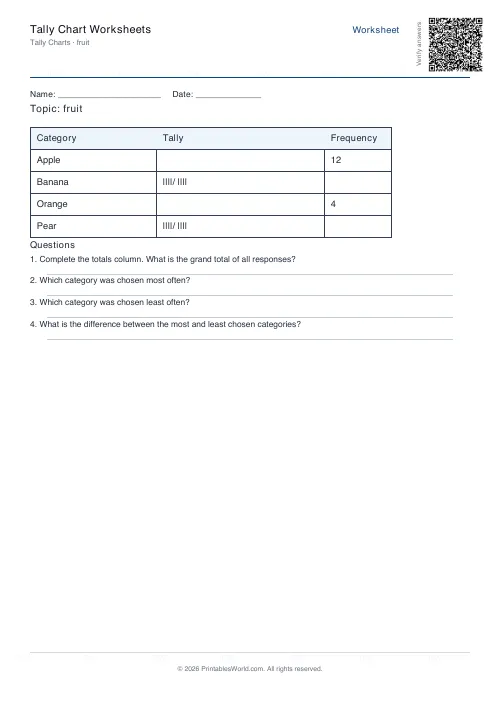
Tally Chart Worksheet — Fruit
Print-ready tally chart worksheet (Fruit) as a free PDF — made with the generator above so you can tweak and reprint.
↓ Download PDF
Tally Chart Worksheet — Colour
Print-ready tally chart worksheet (Colour) as a free PDF — made with the generator above so you can tweak and reprint.
↓ Download PDF
Tally Chart Worksheet — Subject
Print-ready tally chart worksheet (Subject) as a free PDF — made with the generator above so you can tweak and reprint.
↓ Download PDF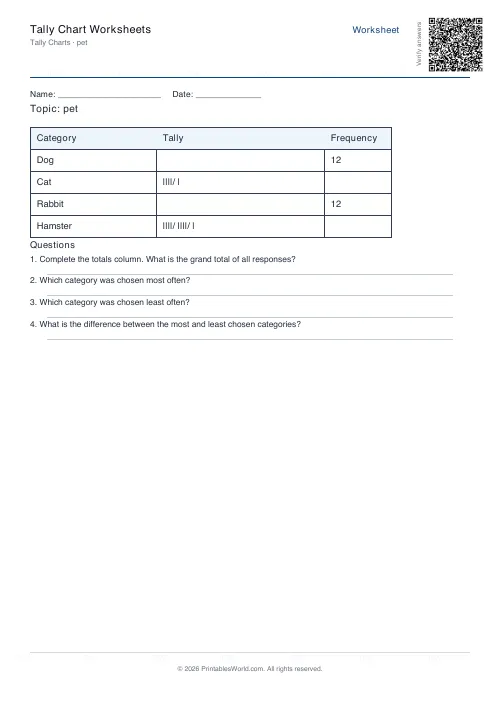
Tally Chart Worksheet — Pet
Print-ready tally chart worksheet (Pet) as a free PDF — made with the generator above so you can tweak and reprint.
↓ Download PDF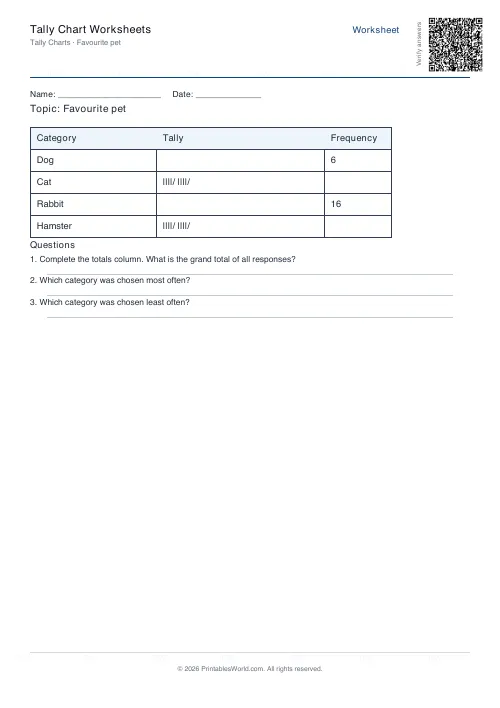
Tally Chart Worksheet — 3 questions
Print-ready tally chart worksheet (3 questions) as a free PDF — made with the generator above so you can tweak and reprint.
↓ Download PDF
Tally Chart Worksheet — 4 questions
Print-ready tally chart worksheet (4 questions) as a free PDF — made with the generator above so you can tweak and reprint.
↓ Download PDF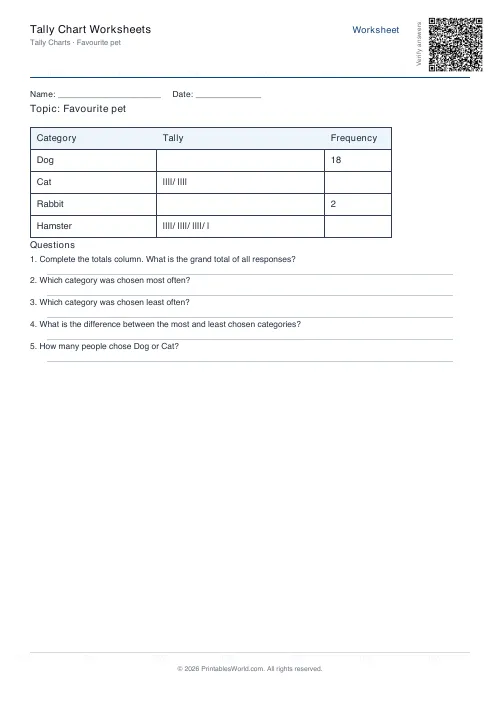
Tally Chart Worksheet — 5 questions
Print-ready tally chart worksheet (5 questions) as a free PDF — made with the generator above so you can tweak and reprint.
↓ Download PDF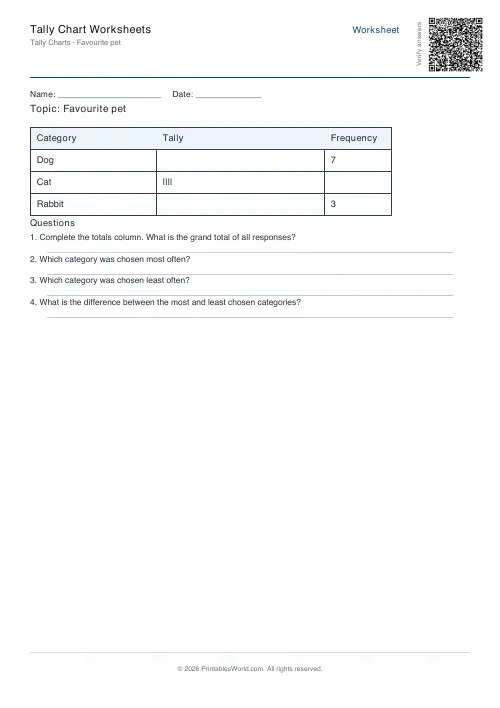
Tally Chart Worksheet — 3 categories, with answer key
Completed answer key for the 3 categories tally chart worksheet — print-ready PDF for fast marking.
↓ Download PDF
Tally Chart Worksheet — 4 categories, with answer key
Completed answer key for the 4 categories tally chart worksheet — print-ready PDF for fast marking.
↓ Download PDF
Settings
Customize your tally chart worksheet
4 categories · 4 questions · A4
Paper size
Preview
Live PDF preview
The actual PDF, updated as you change settings.
People also used
Bar Chart Reading Worksheets
Interpret a bar chart and answer comprehension questions about the data.
Pie Chart Reading Worksheets
Interpret a pie chart with percentages and answer comprehension questions.
Probability Basics Worksheets
Simple probability problems with coins, dice, and spinners — answer as a fraction, decimal, or percent.
Feedback
Spotted something off with this tool?
Create Printable Tally Chart Worksheets for Early Data Handling
Generate free printable tally chart worksheets where learners fill in tally marks in groups of five and convert between tallies and frequency totals.
Create worksheets in A4 or US Letter PDF format for primary data-handling lessons. Each worksheet builds a frequency table on your chosen topic, with some rows showing the tally and asking for the frequency, and other rows showing the frequency and asking for the tally.
This tally chart generator helps parents, teachers, homeschoolers, and tutors produce quick, varied practice on reading tally marks, grouping in fives, and answering survey questions.
Why use this tally chart worksheet generator?
Tally charts are usually the first formal way children record data, so they need repeated, varied practice. This generator alternates which column is blank so learners convert in both directions on the same sheet. Use it for:
- Year 2 and Year 3 data-handling introduction
- classroom survey recording
- homework consolidation
- tutor sessions on counting in fives
- homeschool cross-curricular work (science, PE, weather surveys)
Because every worksheet is a fresh dataset, pupils cannot simply copy last week's answers.
What you can customise
The generator lets you shape the chart around your topic:
- Topic: Enter a theme such as "favourite pet" or "weather this week"
- Number of categories: Between 3 and 6 rows in the table
- Max value: Controls the biggest frequency so the tally marks do not run off the row
- Question count: How many comprehension questions follow the chart
- Include answer key: Appends a completed chart and solutions
- Worksheet title, name and date fields
- Paper size: A4 or US Letter PDF
The table is drawn with clear category labels, a tally column, and a frequency column. Blank cells are left for the learner to fill in.
Notes and limitations
- The tally is always drawn in groups of five with a diagonal crossbar, matching the convention used in UK primary schools.
- The blank column alternates row by row so the learner practises both directions on one sheet.
- Very large frequencies (above ~25) make a row of tallies wrap, which can get messy — keep Max value moderate for clean layout.
- Because the dataset is regenerated each time, repeated downloads give fresh numbers.
Who these worksheets are for
Tally charts appear from Year 2 onwards, so this tool suits early and middle primary learners.
Parents
Give children quick homework-style practice in grouping in fives and reading a frequency table.
Teachers
Use the printable tally chart worksheet as a starter, a morning task, or part of a data-handling mini-project.
Homeschool families
Pair the worksheet with a real mini-survey around the house, such as "how many of each type of fruit are in the kitchen".
Tutors
Target data-handling gaps before SATs with short, varied practice sheets.
Worksheet style options
Mixed conversion
The default style alternates which column is blank. This forces learners to practise both tally-to-frequency and frequency-to-tally.
Smaller tables
3 or 4 categories suit Year 2, where the emphasis is on forming tally marks cleanly in groups of five.
Larger tables
5 or 6 categories suit Year 3 to Year 4, where learners also need to answer totalling and comparison questions.
How to use the tool
- Type a topic such as "favourite ice cream" or "birds spotted".
- Set the number of categories (3 to 6).
- Pick the maximum frequency per row.
- Choose how many comprehension questions to include.
- Turn Include answer key on or off.
- Choose A4 or US Letter paper.
- Click Generate to preview the chart and questions.
- Download the PDF.
Worked example
If you type "favourite pet" with 4 categories and a maximum of 12, the generator might produce dog with a tally of 11, cat shown only as the number 8 (learner must draw the tally), rabbit with a tally of 5, and fish shown only as the number 3 (learner must draw the tally).
The questions then ask for the grand total (27), the most popular pet (dog), the least popular (fish), and the difference between dog and fish (8).
Methodology
The engine picks category labels to fit your topic, assigns a random frequency to each within your Max value, and then alternates per row whether the tally or the frequency column starts blank. Tallies are rendered by drawing vertical lines in groups of four with a diagonal stroke as the fifth. Questions and the answer key are derived from the full dataset so the totals always match.
Helpful preset ideas
- "Favourite fruit" with 4 categories and max 10 for Year 2
- "Weather this week" with 5 categories and max 15 for Year 3
- "Minutes of exercise" with 5 categories and max 20 for Year 4
- "Books read" with 6 categories and max 12 for Year 5
Best ways to practise tally charts
- Model the "four lines, one diagonal" rule before letting learners work alone.
- Ask pupils to count each group of five first, then add on the remaining marks.
- Combine tally worksheets with a real survey the class has just carried out.
- Move on to bar chart reading once tallies are secure, using the same topic.
Designed for A4 and US Letter Printing
Tally chart worksheets are available in A4 and US Letter PDF so you can print cleanly on whichever format your school or home printer uses.
Related maths practice tools
You may also find these related data-handling tools useful:
FAQs
Quick answers
Do learners complete the tally or the frequency?
Both. The generator alternates which column is blank on each row so learners practise converting in both directions.
How many categories can I pick?
Between 3 and 6. The generator picks suitable category labels based on the topic you provide.
What questions are asked?
Grand total, most and least chosen categories, differences between them, and combined counts of two rows.
Do I get an answer key?
Yes. The answer page shows the complete tally chart plus the answer to every question.
Related tools
Bar Chart Reading Worksheets
Interpret a bar chart and answer comprehension questions about the data.
Pie Chart Reading Worksheets
Interpret a pie chart with percentages and answer comprehension questions.
Probability Basics Worksheets
Simple probability problems with coins, dice, and spinners — answer as a fraction, decimal, or percent.
Coordinates Grid Worksheets
Create printable coordinate grid worksheets with 1-quadrant or 4-quadrant layouts.
Timed Multiplication Quiz (Mad Minute)
Classic Mad Minute multiplication drill: 60 times-table questions against the clock with an answer key.
More like this
 Addition Worksheets Generator
 Visual Addition Worksheets Generator
 Subtraction Worksheets Generator
 Multiplication Table Generator
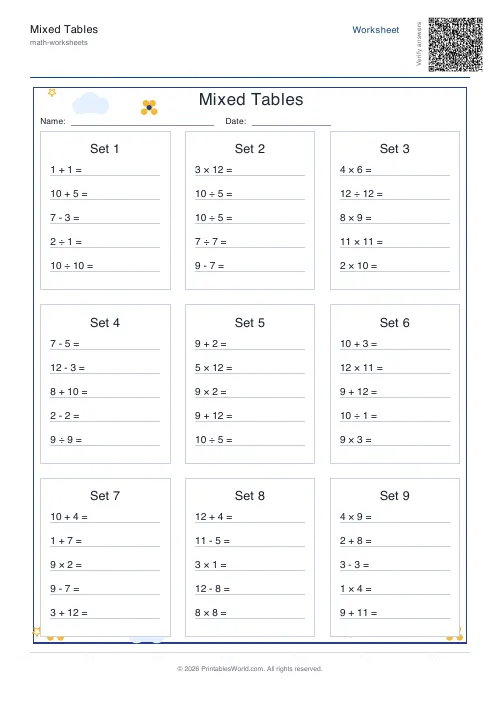 Mixed Tables Generator
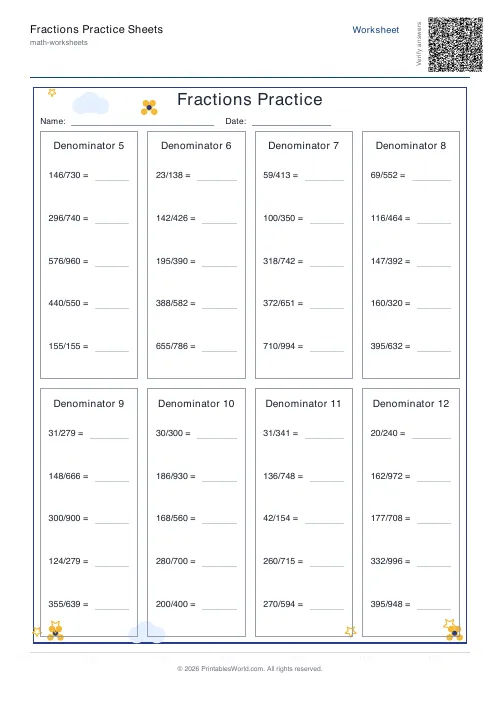 Fractions Practice Sheets Generator
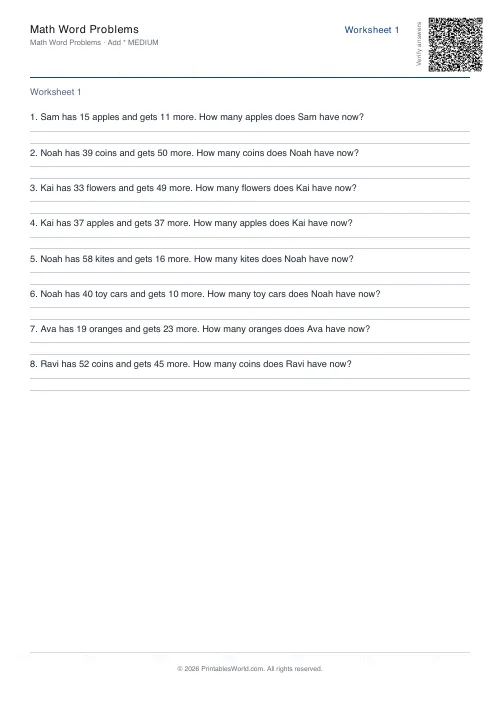 Math Word Problems Generator
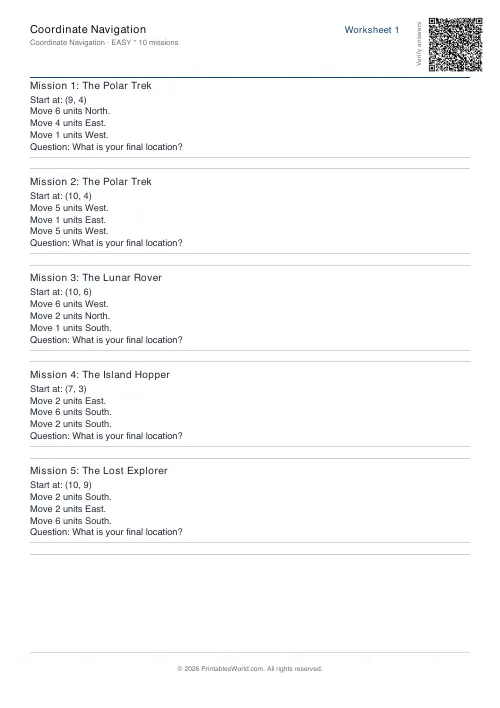 Coordinate Navigation Generator
 Multiplication Tables Worksheet
 Mixed Multiplication Worksheets
 Addition Worksheets — Single Digit
 Addition Worksheets — Double Digit
 Addition Worksheets — Triple Digit
 Subtraction Worksheets — Single Digit