Math Worksheets
Pie Chart Reading Worksheets
Interpret a pie chart with percentages and answer comprehension questions.
Last updated:
What this tool does
Create printable pie chart comprehension worksheets. The PDF shows a coloured pie chart with a legend, using a randomised breakdown that sums to 100%, and asks reading-comprehension questions.
Free downloads
Ready-made Pie Chart Reading Worksheet printables — free PDF downloads
No setup needed — download these print-ready pie chart reading worksheets as free PDFs. Each one was made with the generator above, so you can recreate or fully customize any of them.
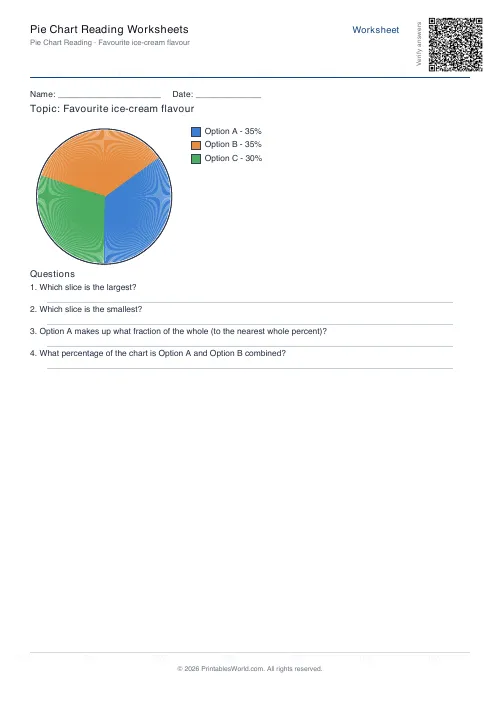
Pie Chart Reading Worksheet — 3 slices
Print-ready pie chart reading worksheet (3 slices) as a free PDF — made with the generator above so you can tweak and reprint.
↓ Download PDF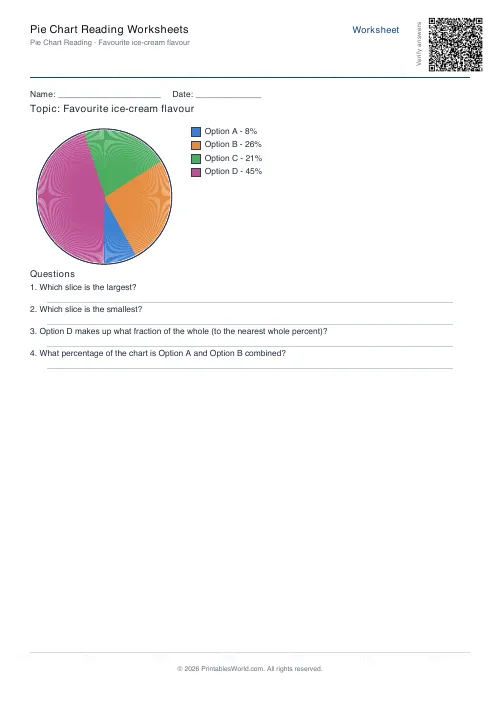
Pie Chart Reading Worksheet — 4 slices
Print-ready pie chart reading worksheet (4 slices) as a free PDF — made with the generator above so you can tweak and reprint.
↓ Download PDF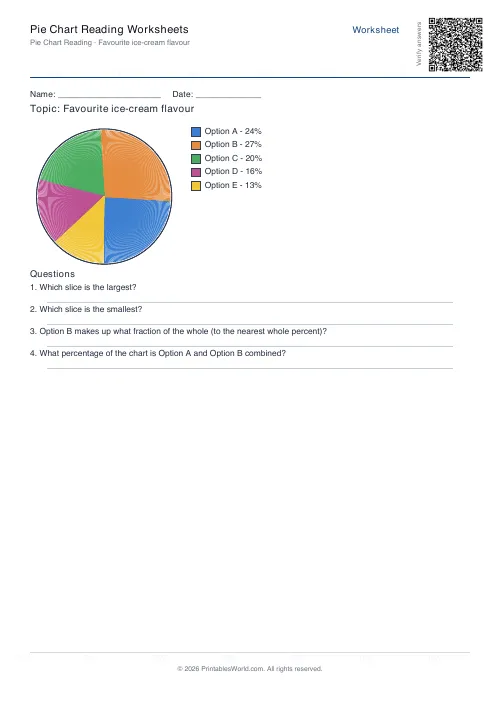
Pie Chart Reading Worksheet — 5 slices
Print-ready pie chart reading worksheet (5 slices) as a free PDF — made with the generator above so you can tweak and reprint.
↓ Download PDF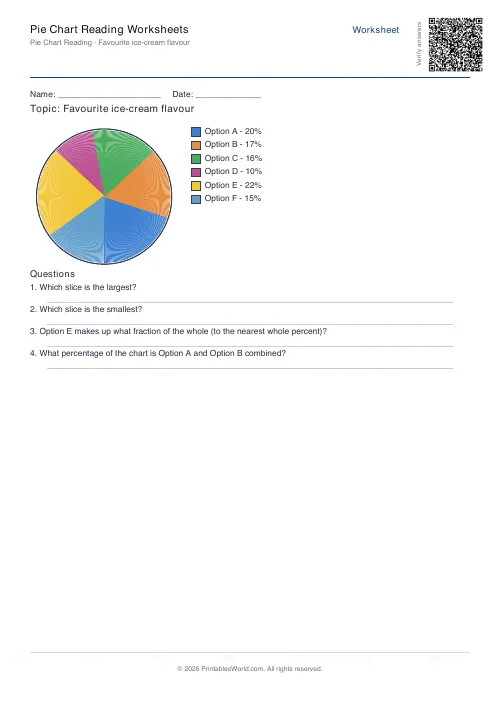
Pie Chart Reading Worksheet — 6 slices
Print-ready pie chart reading worksheet (6 slices) as a free PDF — made with the generator above so you can tweak and reprint.
↓ Download PDF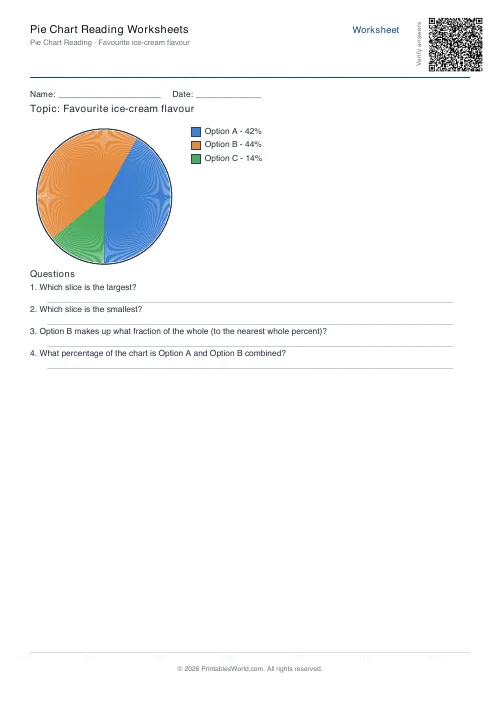
Pie Chart Reading Worksheet — 3 slices, with answer key
Completed answer key for the 3 slices pie chart reading worksheet — print-ready PDF for fast marking.
↓ Download PDF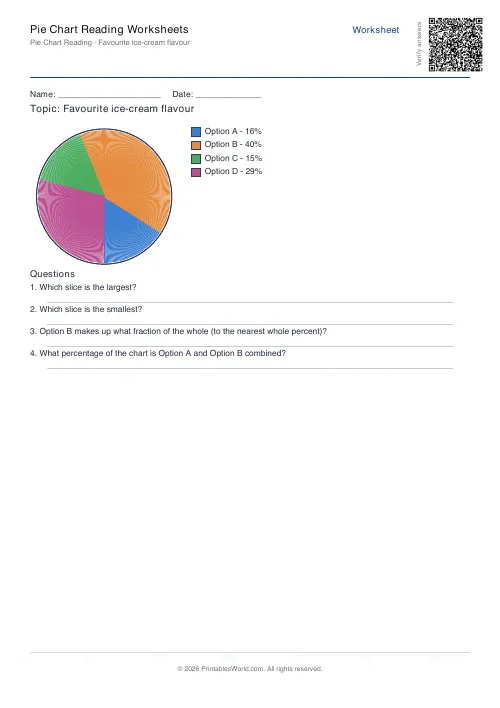
Pie Chart Reading Worksheet — 4 slices, with answer key
Completed answer key for the 4 slices pie chart reading worksheet — print-ready PDF for fast marking.
↓ Download PDF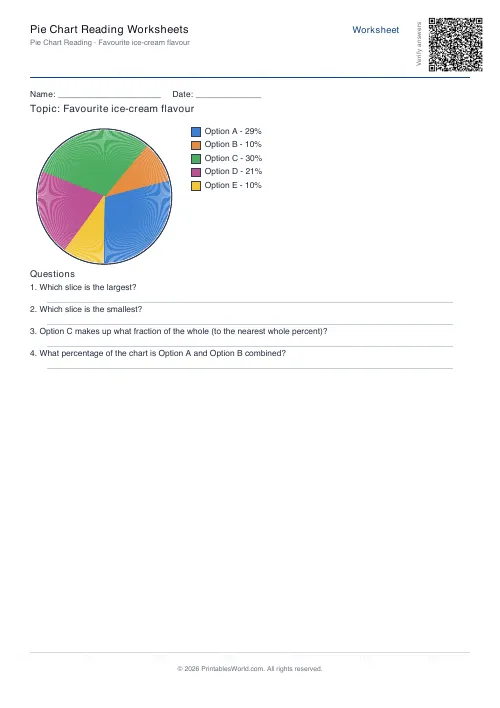
Pie Chart Reading Worksheet — 5 slices, with answer key
Completed answer key for the 5 slices pie chart reading worksheet — print-ready PDF for fast marking.
↓ Download PDF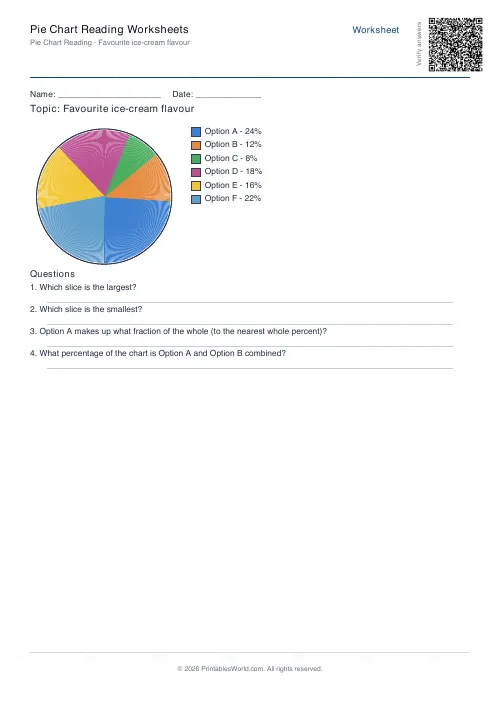
Pie Chart Reading Worksheet — 6 slices, with answer key
Completed answer key for the 6 slices pie chart reading worksheet — print-ready PDF for fast marking.
↓ Download PDF
Settings
Customize your pie chart worksheet
4 slices · 4 questions · A4
Paper size
Preview
Live PDF preview
The actual PDF, updated as you change settings.
People also used
Bar Chart Reading Worksheets
Interpret a bar chart and answer comprehension questions about the data.
Tally Chart Worksheets
Complete a tally chart and frequency table, then answer questions about the data.
Probability Basics Worksheets
Simple probability problems with coins, dice, and spinners — answer as a fraction, decimal, or percent.
Feedback
Spotted something off with this tool?
Create Printable Pie Chart Reading Worksheets with Percentages
Generate free printable pie chart worksheets where a coloured chart and legend are paired with comprehension questions about percentages of a whole.
Create worksheets in A4 or US Letter PDF format for primary and lower secondary data handling lessons. Each worksheet draws a coloured pie chart whose sectors are sized to match percentages that always sum to exactly 100%, plus a matching legend.
This pie chart reading generator helps parents, teachers, homeschoolers, and tutors give learners quick, repeatable practice at interpreting proportional data and reading sectors of a circle.
Why use this pie chart reading generator?
Pie charts test a specific skill: reading sectors as percentages of a whole and comparing slices to each other. Having a fresh chart each time stops pupils memorising single textbook answers. Use it for:
- data handling and statistics lessons
- classroom starters and exit tickets
- homework or revision before a test
- SATs-style percentage comprehension
- tutor practice on proportional reasoning
- homeschool topic work on surveys and data
The generator normalises the slice values so they always total 100%, which keeps the arithmetic clean for the learner.
What you can customise
The tool lets you shape the chart, the topic, and the question set:
- Topic: Enter a theme such as "favourite hobby" or "time spent at school"
- Number of slices: Between 3 and 6
- Question count: How many comprehension questions follow the chart
- Include answer key: Appends a full answers page
- Worksheet title, name and date fields
- Paper size: A4 or US Letter PDF
The pie chart is drawn with distinct fill colours and a readable legend, so learners can match each slice to its label without squinting.
Notes and limitations
- Slice percentages are normalised to sum to 100% exactly, so you do not get rounding errors on the answer key.
- Because values are regenerated per download, two exports on the same settings will not match.
- 3 or 4 slices read most clearly on A4; 6 slices print well but the smallest sectors can be narrow.
- This tool uses percentages only — it does not convert to fractions of the whole on the chart.
Who these worksheets are for
Pie chart reading appears across the primary and lower secondary curriculum, so the generator suits many users.
Parents
Use printable pie chart worksheets at home to practise percentages and reading a circular graph away from the screen.
Teachers
Produce whole-class comprehension tasks, or give different topics to different ability groups while keeping the skill identical.
Homeschool families
Tie the worksheet to a survey the learner has just carried out — choice of ice cream, hours spent in each lesson, or family screen time.
Tutors
Build SATs-style revision on reading proportional data and combining percentages.
Worksheet style options
Standard comprehension set
The default questions ask for the largest slice, the smallest slice, the combined percentage of two slices, and the order of slices from largest to smallest.
Smaller charts
3 or 4 slices suit Years 4 to 5, where learners are getting comfortable with percentages for the first time.
Larger charts
5 or 6 slices are a better fit for Year 6 to Year 8, where comparing several proportions is expected.
How to use the tool
- Type a topic such as "favourite subjects" or "weekend activity".
- Set the number of slices (3 to 6).
- Pick how many questions to include.
- Turn Include answer key on or off.
- Choose A4 or US Letter paper.
- Click Generate to preview the coloured pie chart and legend.
- Download the PDF.
Worked example
Say you type the topic "favourite hobby" and choose 4 slices. The generator might produce reading = 35%, gaming = 25%, sport = 25% and music = 15%. The legend shows each label with its matching colour, and the pie chart is drawn with sectors sized to those percentages.
The questions then ask: which hobby was the most popular (reading, 35%)? Which was the least popular (music, 15%)? What is the combined percentage for gaming and sport (50%)? And order the hobbies from largest to smallest (reading, gaming and sport joint second, music).
Methodology
The engine picks category labels from your topic, assigns random proportions, normalises them so they sum to exactly 100%, and draws the pie chart by calculating each sector's start and end angle from those percentages. A colour palette is applied so adjacent slices stay distinct. Questions are derived from the same dataset so the answer key is always consistent with the chart.
Helpful preset ideas
- "Favourite lesson" with 4 slices for Year 4
- "How I spent my weekend" with 5 slices for Year 5
- "Budget categories" with 6 slices for Year 7 to Year 8
- "Weather this month" with 4 slices for a topic-linked starter
Best ways to practise pie chart reading
- Check that the percentages add to 100 before answering the questions.
- Match each legend colour to its slice before reading values.
- Encourage pupils to estimate the largest slice by eye first, then check the percentage.
- Practise combining two slices by simple addition before moving to harder questions.
Designed for A4 and US Letter Printing
The pie chart worksheet generator outputs PDFs in both A4 and US Letter so you can print on either format at home or at school. The chart, legend, and question area all rescale to the chosen paper size.
Related maths practice tools
You may also find these related data and percentage tools useful:
FAQs
Quick answers
Is the pie chart drawn in the PDF?
Yes. Each worksheet includes a coloured pie chart with a matching legend, drawn directly in the PDF.
How many slices are shown?
Between 3 and 6 slices. The generator normalises the percentages so they always sum to exactly 100%.
What questions are asked?
Largest and smallest slices, combined percentages of two slices, and ordering the slices from largest to smallest.
Do I get an answer key?
Yes. The answer key lists every slice with its percentage plus the answers to every question.
Related tools
Bar Chart Reading Worksheets
Interpret a bar chart and answer comprehension questions about the data.
Tally Chart Worksheets
Complete a tally chart and frequency table, then answer questions about the data.
Probability Basics Worksheets
Simple probability problems with coins, dice, and spinners — answer as a fraction, decimal, or percent.
Coordinates Grid Worksheets
Create printable coordinate grid worksheets with 1-quadrant or 4-quadrant layouts.
More like this
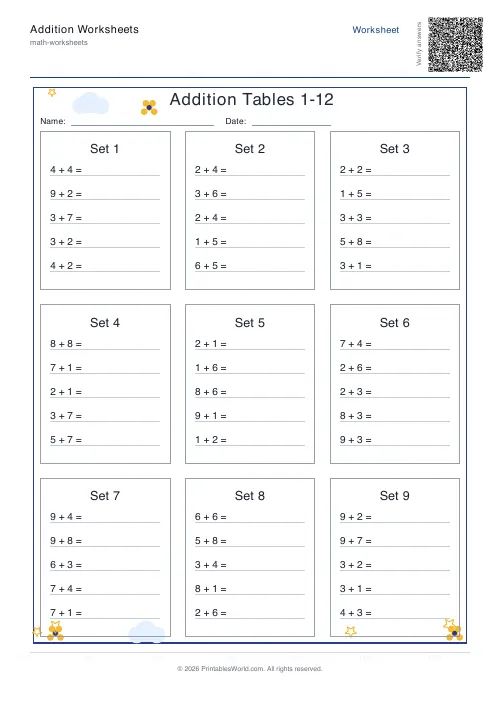 Addition Worksheets Generator
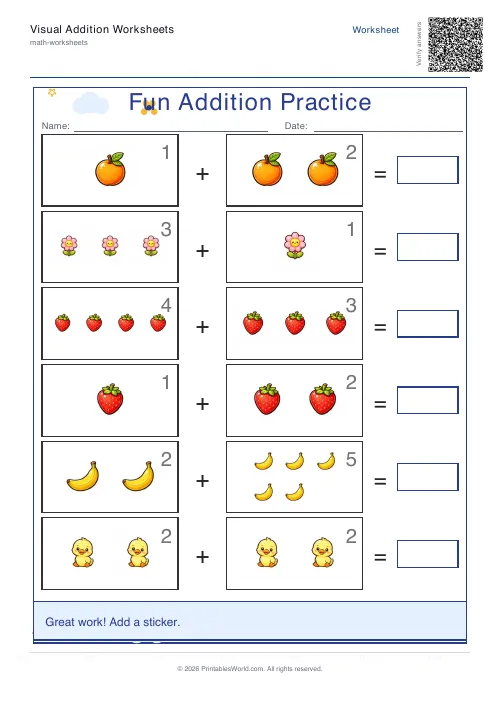 Visual Addition Worksheets Generator
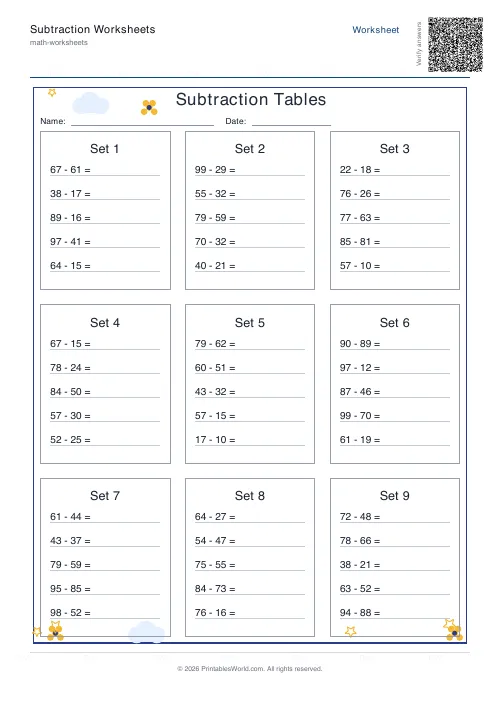 Subtraction Worksheets Generator
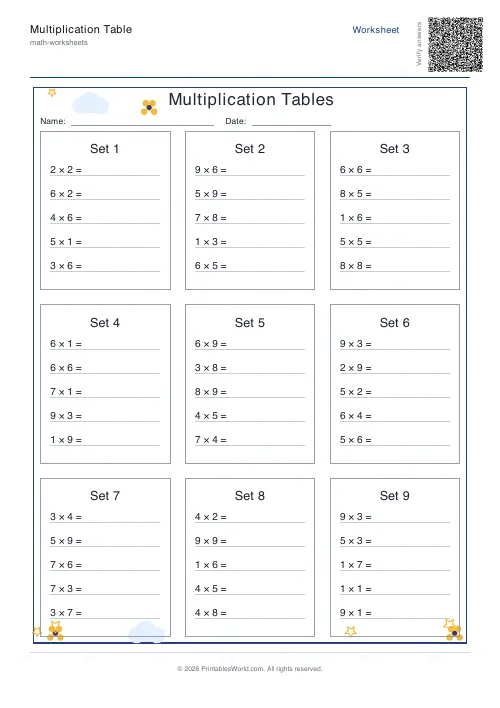 Multiplication Table Generator
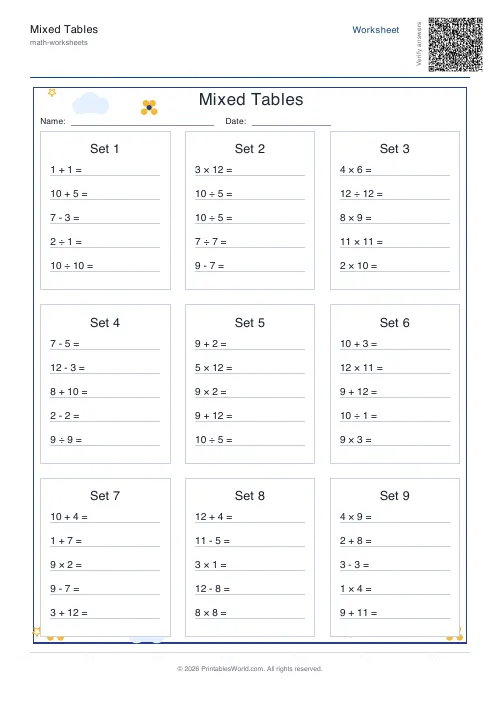 Mixed Tables Generator
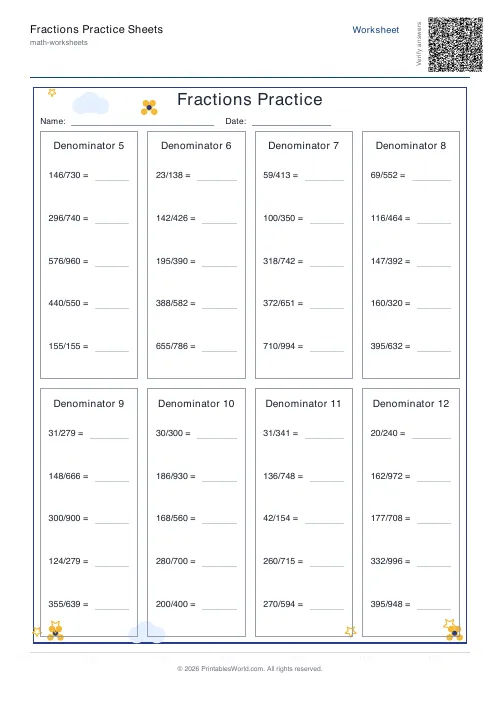 Fractions Practice Sheets Generator
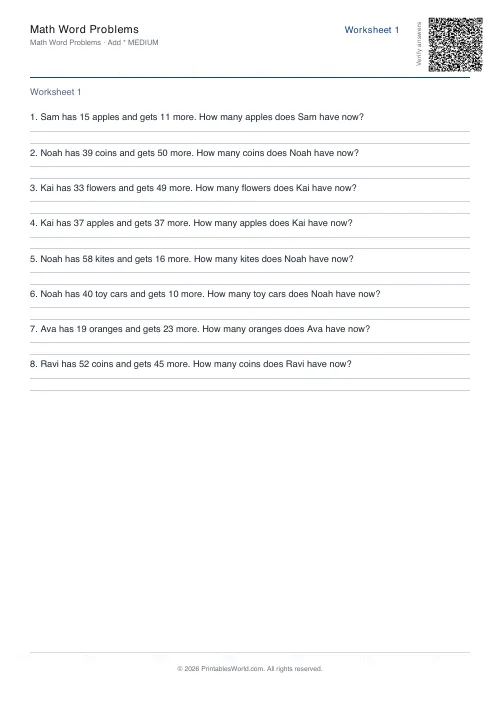 Math Word Problems Generator
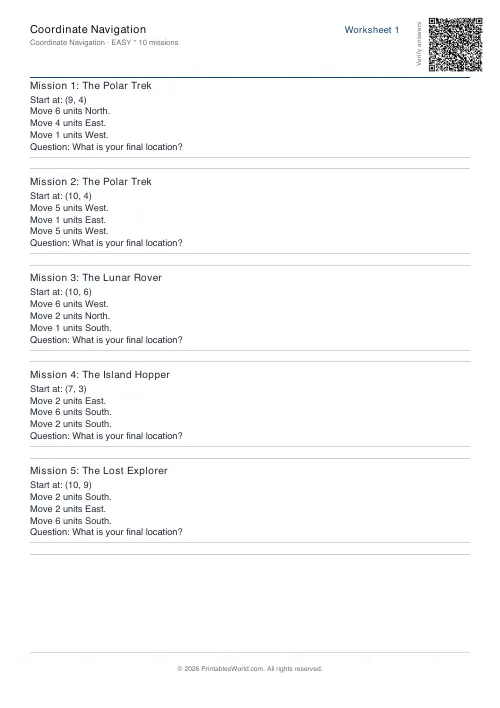 Coordinate Navigation Generator
 Multiplication Tables Worksheet
 Mixed Multiplication Worksheets
 Addition Worksheets — Single Digit
 Addition Worksheets — Double Digit
 Addition Worksheets — Triple Digit
 Subtraction Worksheets — Single Digit