What this tool does
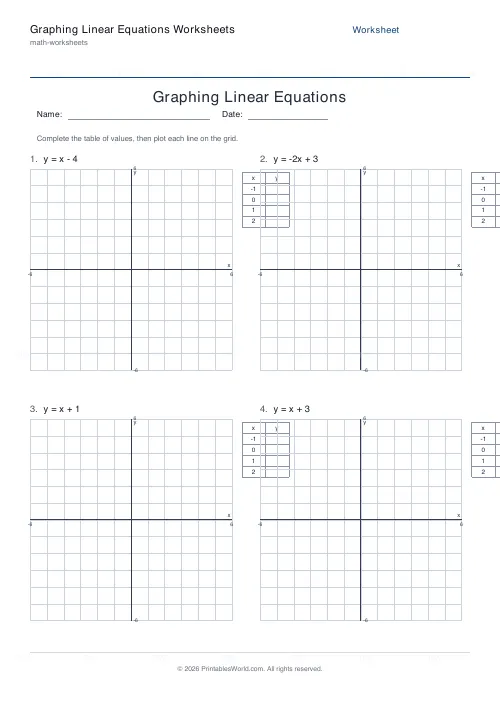
Each problem gives a linear equation, a small table of values to complete, and a printed labelled grid to plot the line on. The answer key lists two points on each line.
People also used
Coordinates Grid Worksheets
Create printable coordinate grid worksheets with 1-quadrant or 4-quadrant layouts.
Equation Solving Worksheets
Printable one-step and two-step linear equations to solve.
Introduction to Algebra Worksheets
Printable beginner algebra practice. Evaluate, simplify, and substitute.
Feedback
Spotted something off with this tool?
Equation, table, grid
Every problem gives you an equation in the form y = mx + b, a short x/y table to fill in, and a labelled coordinate grid with axes and unit gridlines to plot on.
Four problems by default, laid out two to a row, up to six on a page. The answer key gives two points that lie on each line.
The table is the method
It is printed rather than left to the pupil because the table is the technique, and pupils who skip it plot from intuition and get it wrong.
Pick three x values, substitute each into the equation, get three y values, plot the three points. Three, not two — two points define a line and give you no way of knowing whether you made an arithmetic error, while three that fail to line up tell you immediately that one of them is wrong.
Choose 0 as one of them. Substituting zero is trivial and it lands you on the y-intercept, which is a useful check in itself.
What m and b mean on the page
Worth connecting explicitly, because pupils can plot correctly for months without noticing.
b is where the line crosses the y-axis. Look at y = 2x + 3 and you know before plotting anything that it passes through (0, 3). m is the steepness: from any point, go one right and m up. A negative m goes down instead, which is why those lines slope the other way.
A pupil who has that can sketch a line without a table at all, and can tell at a glance that a plotted line is wrong.
Common errors
Sign errors on negative gradients, by a distance. Then substituting into the wrong variable. Then plotting (y, x) instead of (x, y), which is the coordinate-order error arriving in new clothing.
The three-point rule catches all of them, which is why it is worth insisting on rather than allowing two.
Reading the answer key
It lists two points rather than drawing the line, and that is deliberate: there is no other honest way to give an answer for a graph on paper.
Check the pupil's line passes through both. If it does, the line is right, whatever the pencil work looks like.
Level and next steps
Usually ages twelve to fifteen. It needs coordinates to be secure first, and it leads into simultaneous equations — where two lines crossing is the same thing as the algebraic solution, which is a genuinely satisfying moment for a class that has done both.
See also systems of equations.
FAQs
Quick answers
What form are the equations written in?
Every equation is in slope-intercept form, y = mx + b. The slope m is a whole number from -3 to 3 (never 0) and the intercept b ranges from -4 to 4, so each line fits neatly on the printed grid.
Does each problem come with its own coordinate grid?
Yes. Every equation prints above its own labelled coordinate grid with axes and unit gridlines from -6 to 6, plus a blank x/y table for the student to complete. You do not need separate graph paper.
How many equations can I put on one page?
Between 2 and 6. Fewer equations means larger grids, which are easier to plot on; six grids fill the page in a two-column layout while staying large enough to read.
What does the answer key show?
For each equation the key lists two correct points that lie on the line, for example (0, 3) and (1, 5). Checking that a student's line passes through both points is a fast way to mark the work.
Which x values are in the table?
The table supplies x = -1, 0, 1 and 2 with blank y cells. Students substitute each x into the equation, record the y value, then plot the four points and draw the line.
Will the worksheet print correctly on US Letter paper?
Yes. The layout fits both A4 and US Letter without cropping or scaling. Just pick your paper size in the settings and print at 100%.
Can I get fractional slopes or standard-form equations?
Not currently. This generator focuses on whole-number slope-intercept graphing so every line lands on grid intersections. For related practice, try the equation solving or coordinates grid tools.
Related tools
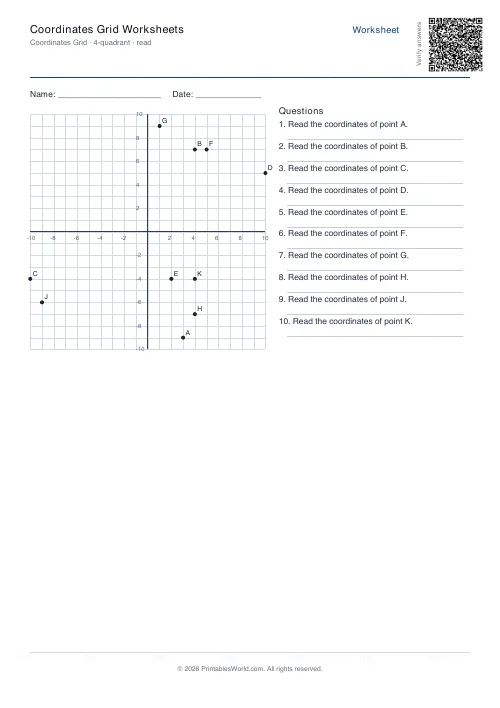
Coordinates Grid Worksheets
Create printable coordinate grid worksheets with 1-quadrant or 4-quadrant layouts.
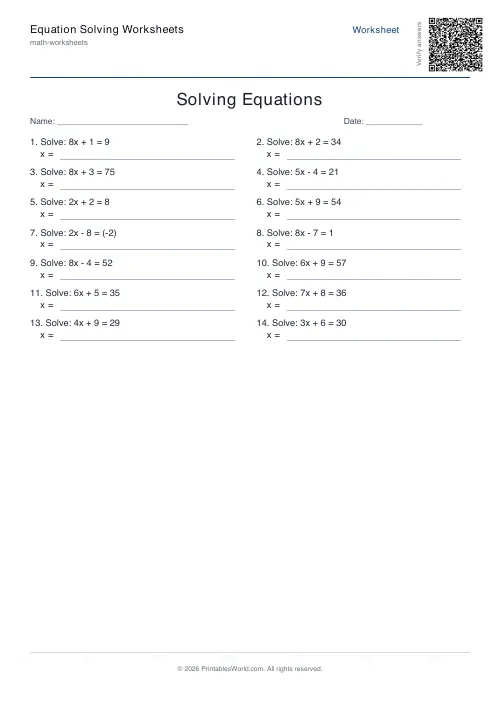
Equation Solving Worksheets
Printable one-step and two-step linear equations to solve.
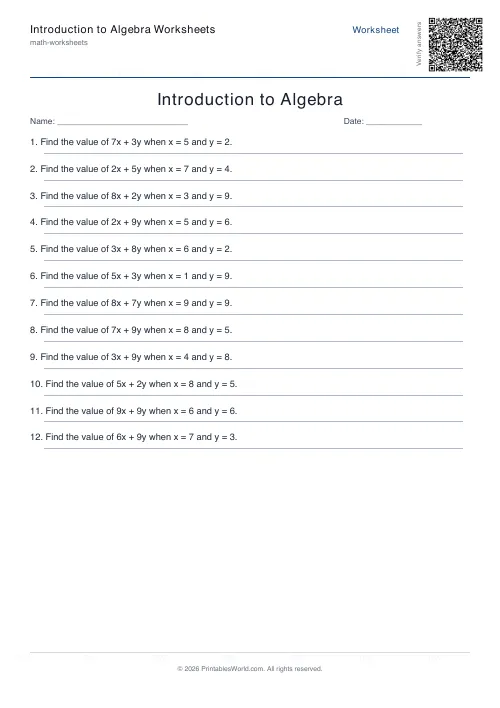
Introduction to Algebra Worksheets
Printable beginner algebra practice. Evaluate, simplify, and substitute.
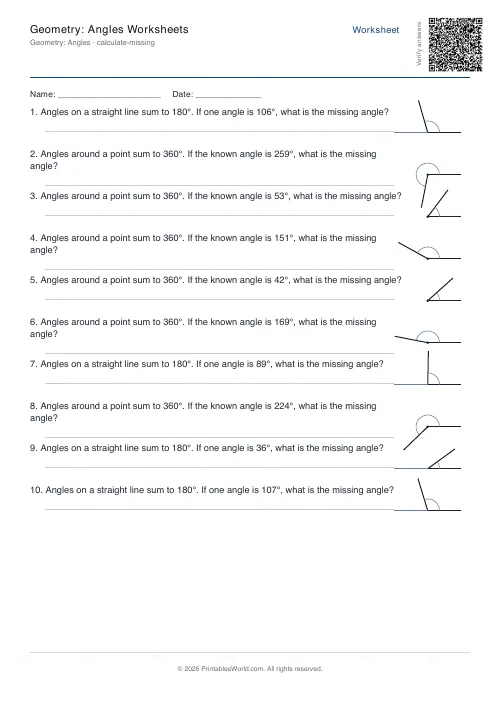
Geometry: Angles Worksheets
Print identify, measure, and calculate-missing-angle worksheets with diagrams for every problem.
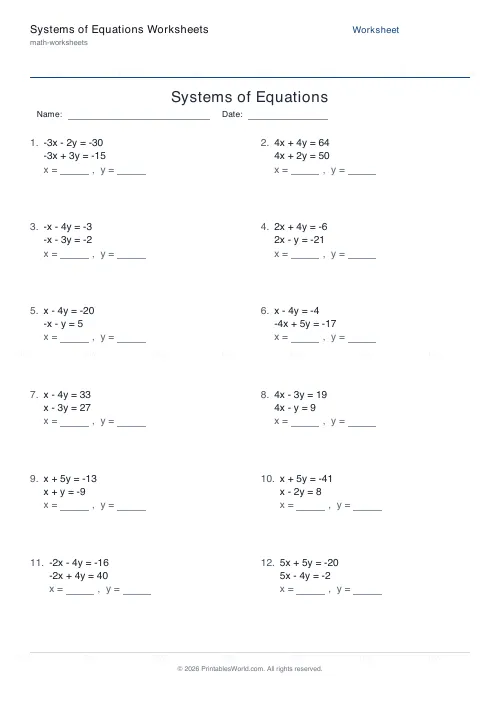
Systems of Equations Worksheets
Generate printable 2x2 linear system worksheets solved by substitution or elimination, with integer answers.
Further reading
Math & Numeracy
How to help a child who's stuck on times tables
A simple two week plan to help child with times tables, using short daily practice and free printable multiplication grids you can customise and print.
7 min read
Math Worksheets
Addition strategies: number lines, regrouping and more
Column addition is the destination, not the route. Here are the strategies that come before it, why each matters, and how to tell which one a child is actually using.
5 min read
Math Worksheets
Understanding BODMAS and PEMDAS: order of operations explained
BODMAS and PEMDAS describe the same rule in different words. The trouble is that both hide two facts the acronym cannot express. Which is where nearly every mistake comes from.
5 min read
More like this
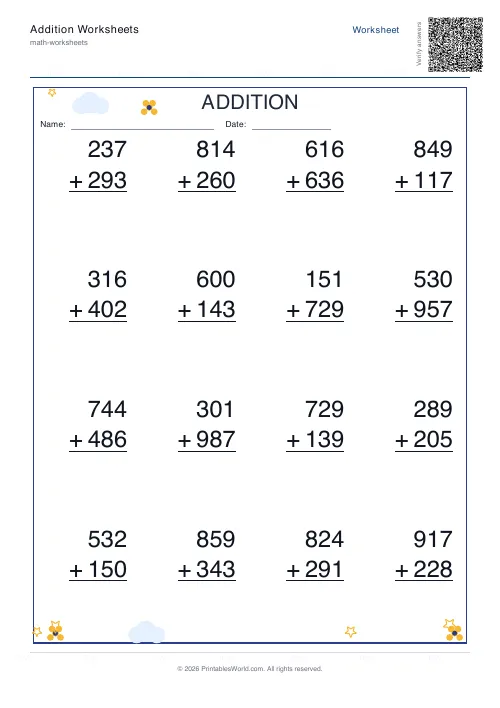 Addition Worksheets Generator
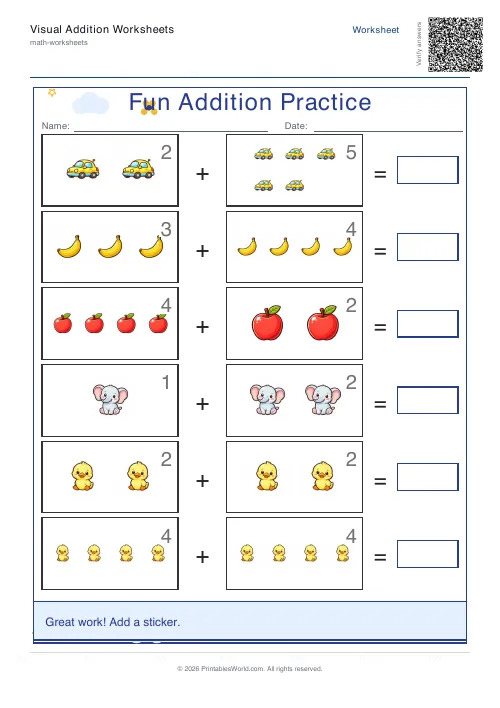 Visual Addition Worksheets Generator
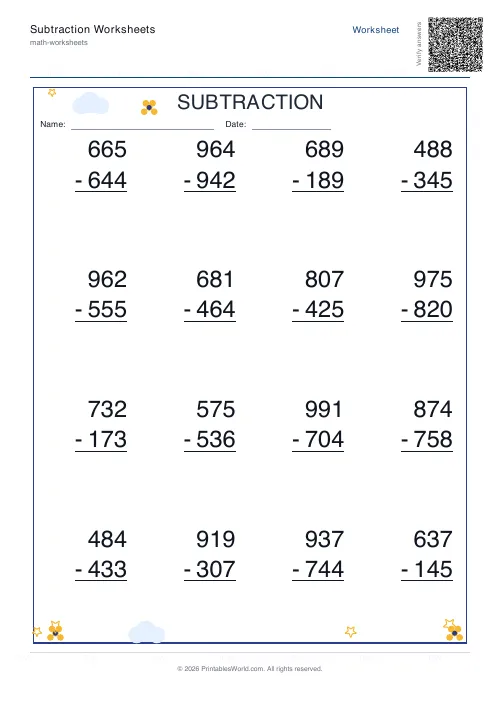 Subtraction Worksheets Generator
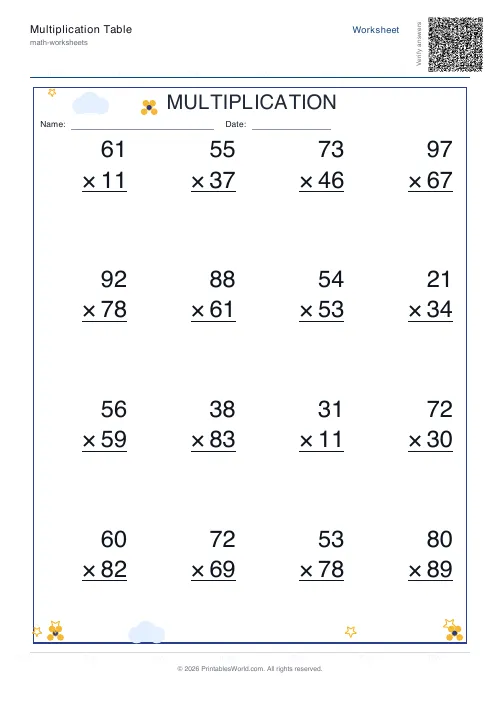 Multiplication Table Generator
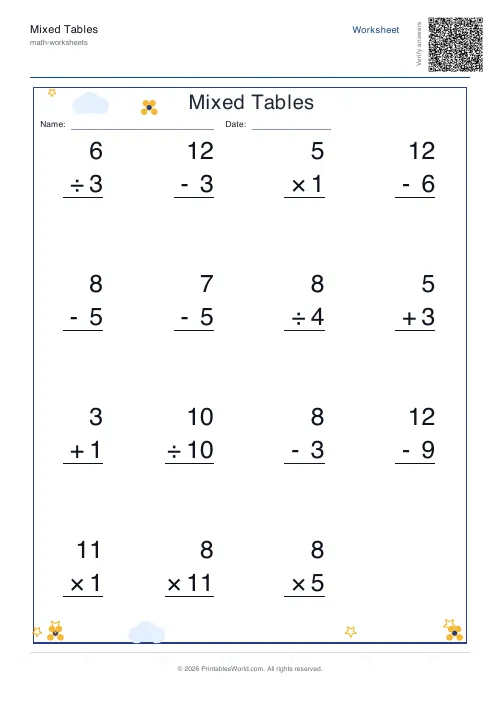 Mixed Tables Generator
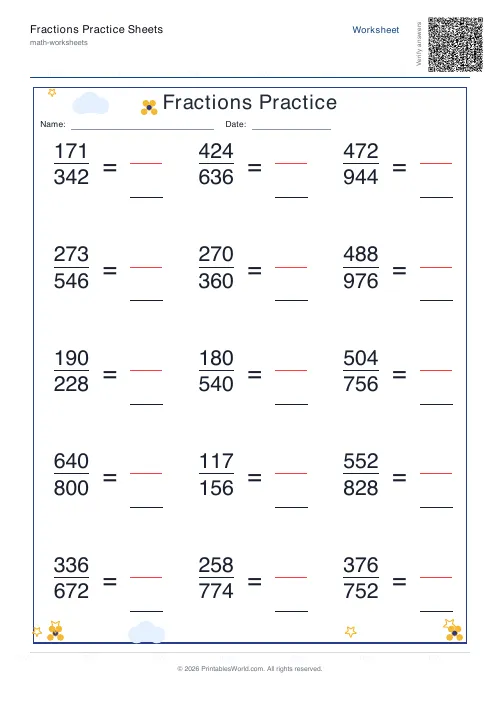 Fractions Practice Sheets Generator
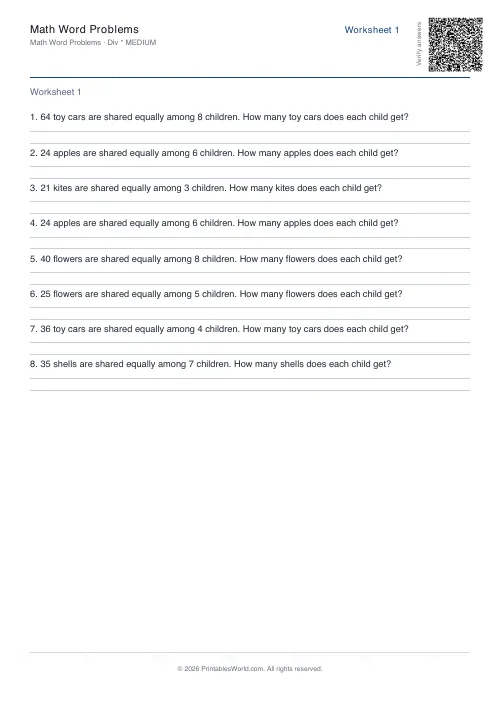 Math Word Problems Generator
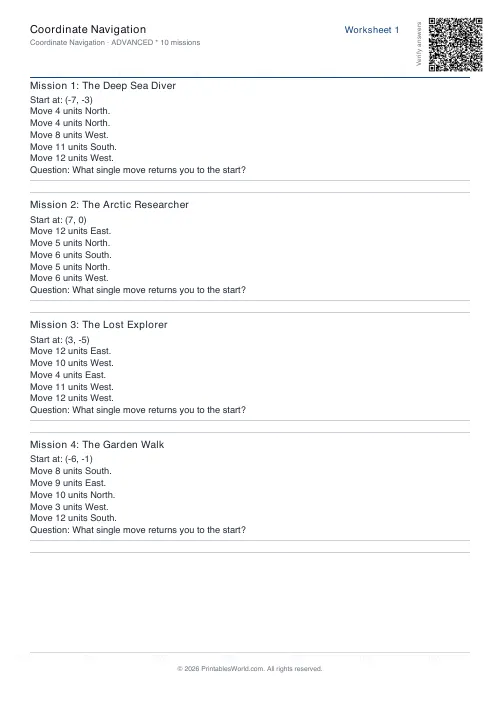 Coordinate Navigation Generator
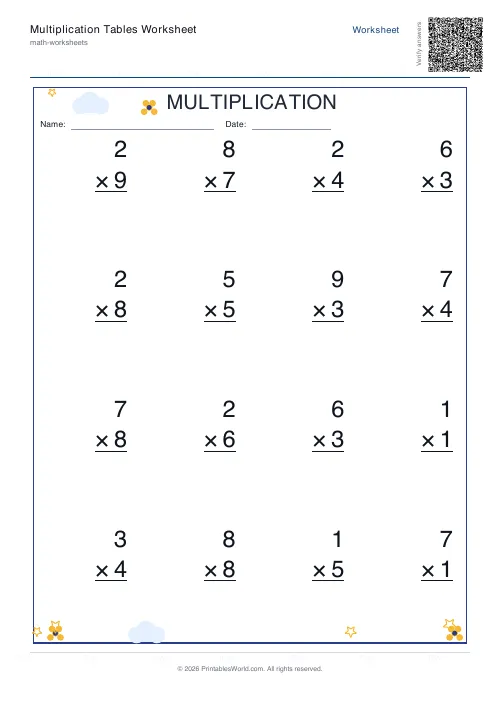 Multiplication Tables Worksheet
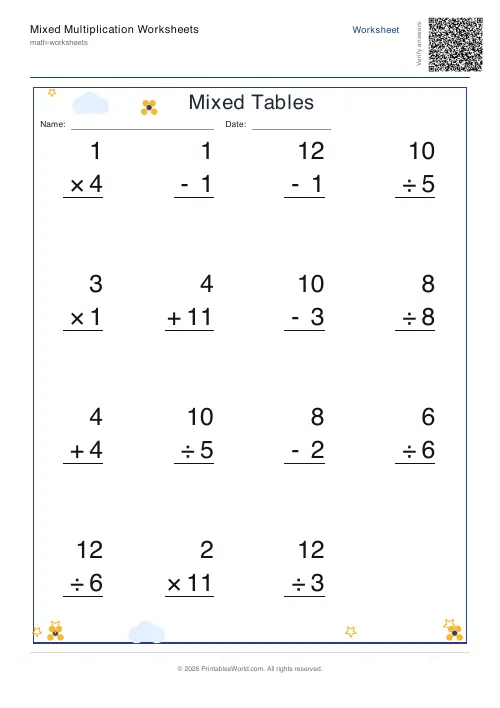 Mixed Multiplication Worksheets
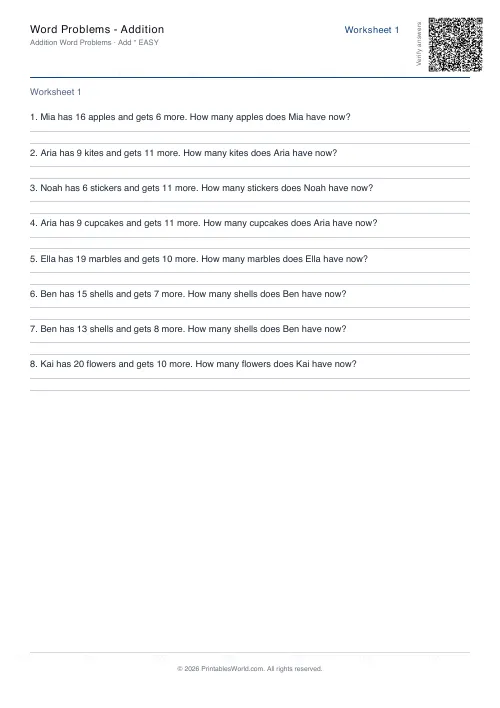 Word Problems: Addition
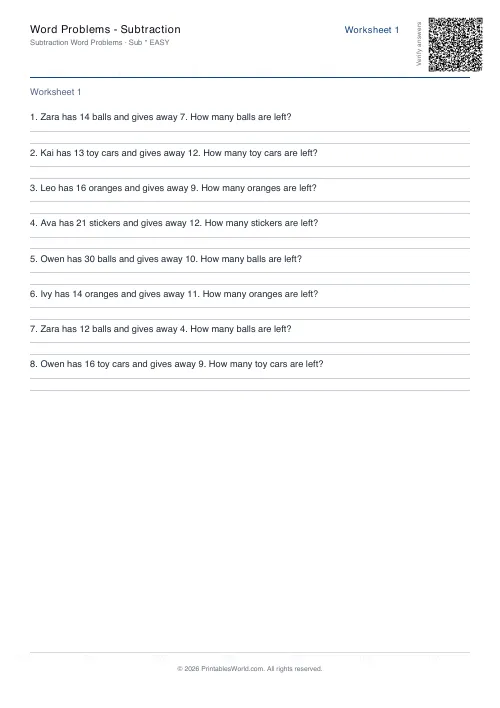 Word Problems: Subtraction
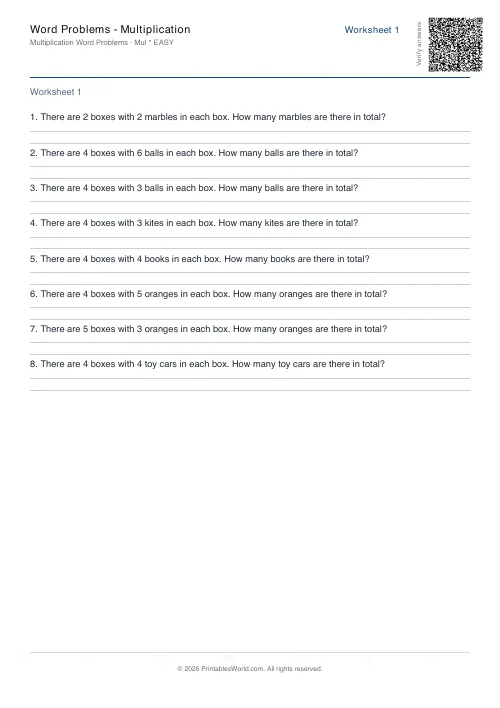 Word Problems: Multiplication
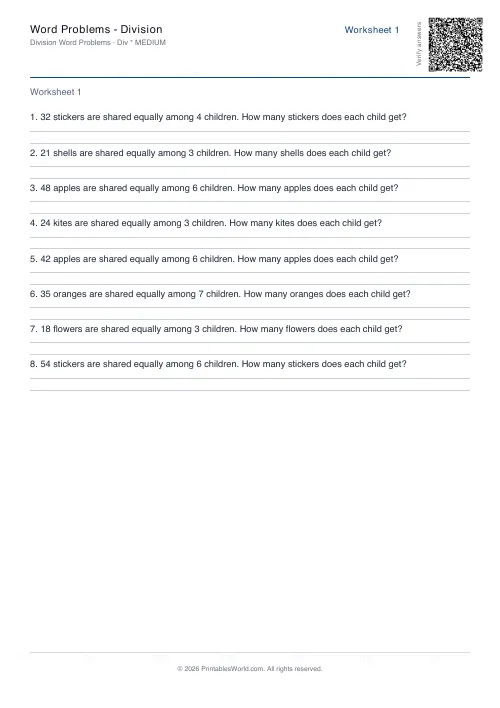 Word Problems: Division