What this tool does
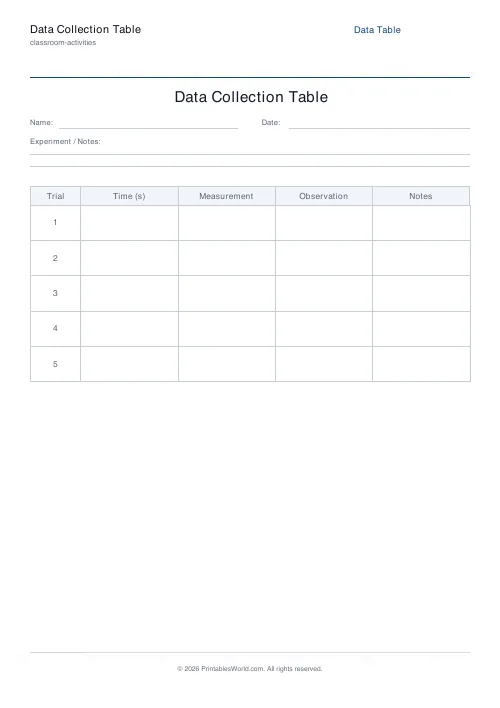
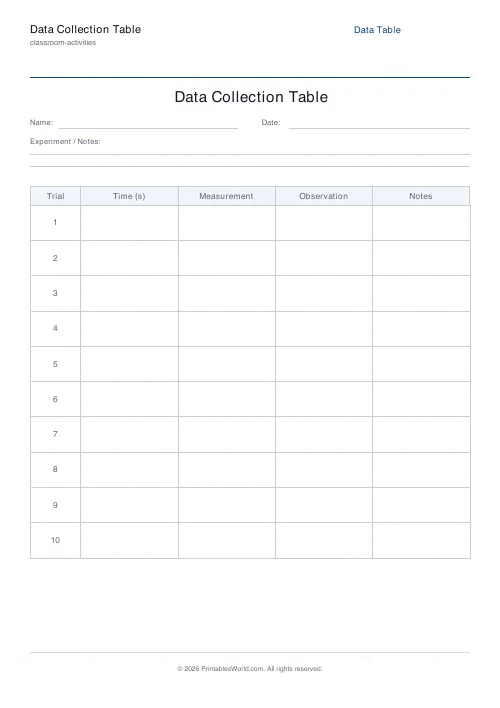
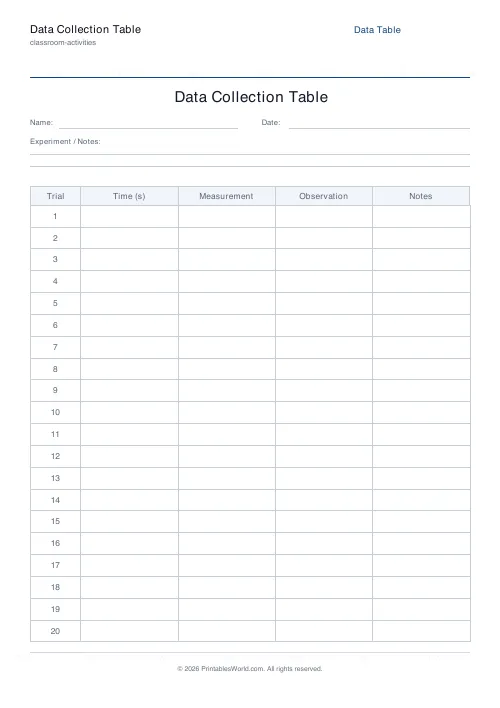
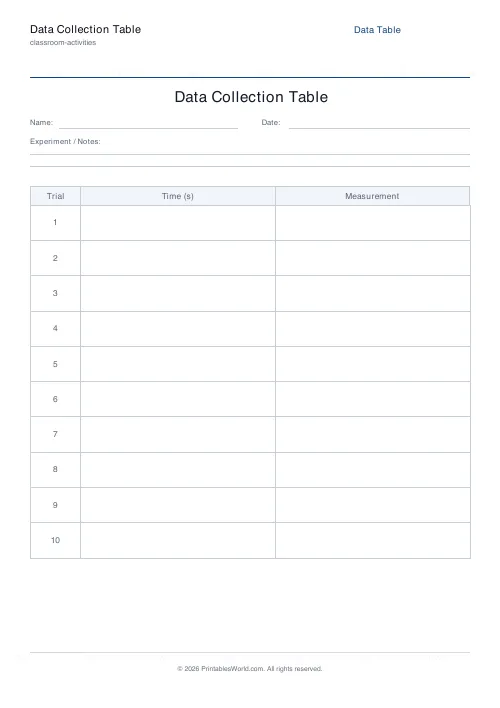
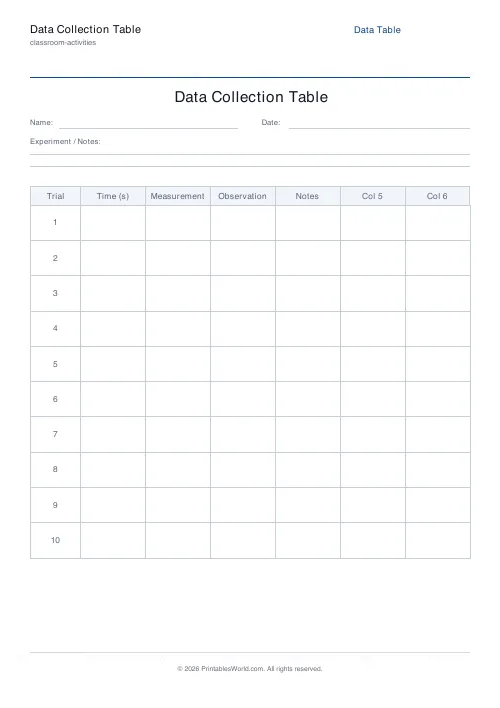
A blank data table with your own column headings, up to eight columns, and 2 to 30 numbered rows. The row label is yours to set: Trial, Reading, Day, whatever you are counting.
People also used
Feedback
Spotted something off with this tool?
A table with your headings and numbered rows
Type the column headings, set how many rows and columns, and print. Rows are numbered and carry a label you choose — Trial by default, but Reading, Day or Sample if that fits better. The numbering sounds trivial and is the main reason to print a table rather than draw one.
Numbered rows change how the data gets recorded
A numbered row is a reference. "Trial 7 looks wrong" is something you can say across a bench and be understood. "The one about two-thirds of the way down" is not.
It also makes a missing entry visible. A hand-drawn table with a blank line in the middle looks like nothing happened; a numbered table with row 9 empty is a question that gets asked.
Headings written before the experiment, not after
This is the part worth insisting on with a class.
Deciding what to record forces you to decide what you are measuring, and the number of experiments that go wrong because nobody wrote down the starting temperature is high. A table with its headings filled in before anything happens is a plan; the same table filled in afterwards is a transcription of whatever happened to be noticed.
Put the units in the heading rather than beside every number. "Length (cm)" written once is clearer than "cm" written twenty times, and it stops the sheet where half the entries say cm and half say mm.
How many rows
More than the number of readings you expect. Repeats are the whole basis of a fair test and they get skipped when the table has room for exactly three.
For anything measured, three readings per condition is the usual minimum, and a table sized for it is a quiet instruction to take them.
Leave room for the anomalies
A column headed "notes" is worth its width. The reading that was taken while somebody knocked the bench, the one where the timer was started late — those need recording at the time, because by the time you are looking at the numbers you will not remember which one it was.
A result that looks wrong and has a note explaining why is usable. The same result without a note has to be either kept or discarded on a guess.
What it is for
Science practicals, obviously. Also surveys, where each row is a respondent. Observations over time. Stock counts, reading logs, practice records, anything where the same set of things is recorded repeatedly.
It also makes a reasonable register or checklist, with names in the first column and dates across the top.
Settings and printing
A title, the row label, up to eight column headings, and 2 to 30 rows. A4 or US Letter, printed at 100%. Fewer rows means taller rows, which matters if the notes column is going to hold a sentence.
Landscape is worth considering once you are past five or six columns — print the PDF rotated rather than squeezing eight into portrait width.
FAQs
Quick answers
How many rows and columns can I have?
Between 4 and 20 rows, and 2 to 6 columns. The table scales automatically to fill the page, so more rows make each row shorter and vice versa.
Can I name each column?
Yes. Type a header for each column (for example "Time (s)", "Distance (cm)", "Observation"). Unused columns default to generic labels.
What is the "row label" for?
It's an optional narrow left column that auto-numbers each row (Trial 1, Trial 2, …). Set it to "Trial", "Day", "Student" or any label that fits your experiment, or leave it blank to remove the column.
Can I use it for surveys or maths as well as science?
Yes. Any activity that needs a neat tabular recording sheet works. Science practicals, maths surveys, reading logs, sports stats.
Related tools
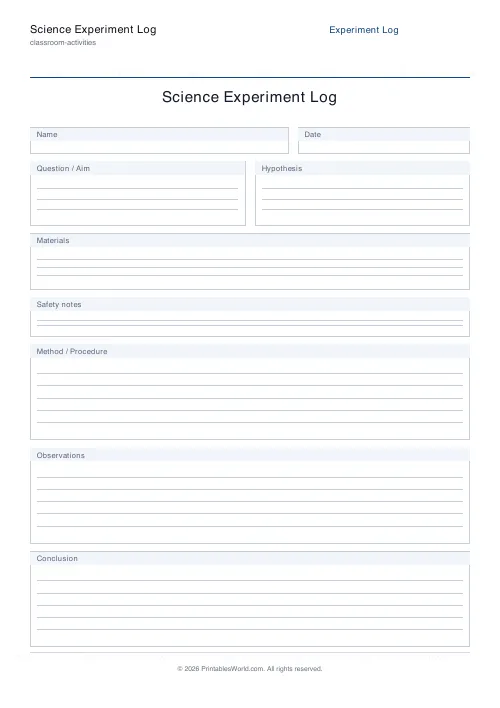
Science Experiment Log
Printable lab log with question, hypothesis, materials, method, observations and conclusion.
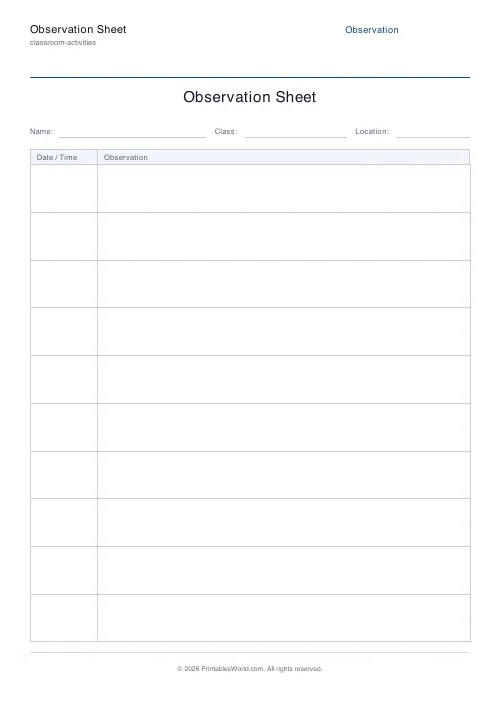
Observation Sheet
Generic ruled observation template. Date and observation rows for any subject.
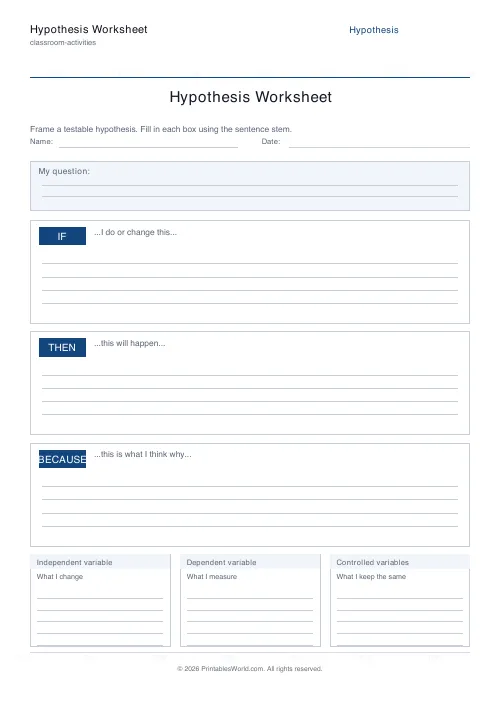
Hypothesis Worksheet
"If / Then / Because" scaffold for framing a testable hypothesis.
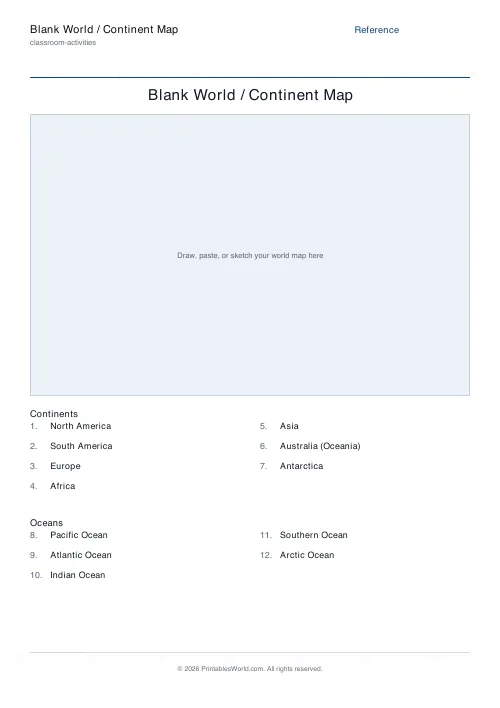
Blank World Map
Real coastlines and country borders, with numbered lines to label the seven continents and five oceans.
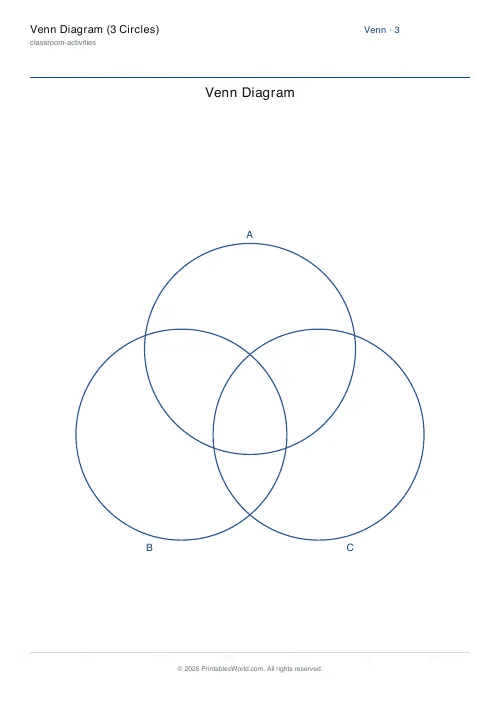
Venn Diagram (3 Circles)
Blank three-circle Venn diagram with custom labels for multi-way comparison.