Printable Paper
Log-Log Graph Paper
Both axes logarithmic — for power-law data spanning huge ranges.
Last updated:
What this tool does
Log-log graph paper — both axes logarithmic. Default span is 4 decades on each axis (1–10,000). Use it for power-law data, frequency response plots, and any relationship that follows y = a·xⁿ.
Free downloads
Ready-made Log-Log Graph Paper printables — free PDF downloads
No setup needed — download these print-ready log-log graph paper as free PDFs. Each one was made with the generator above, so you can recreate or fully customize any of them.
Log-Log Graph Paper — 2 decades
Print-ready log-log graph paper (2 decades) as a free PDF — made with the generator above so you can tweak and reprint.
↓ Download PDF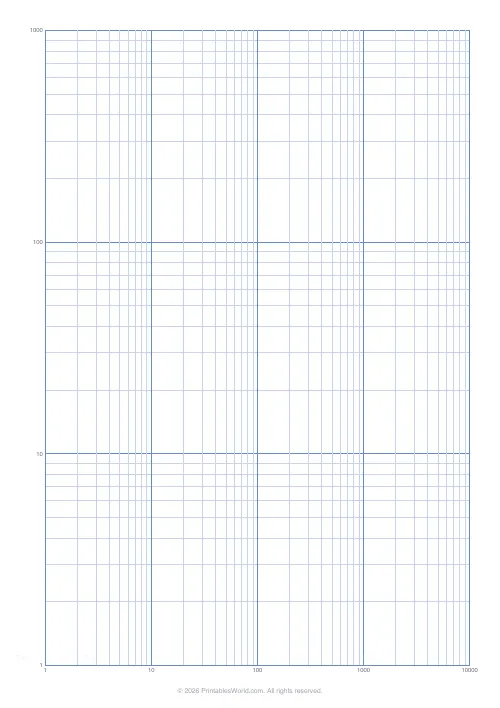
Log-Log Graph Paper — 3 decades
Print-ready log-log graph paper (3 decades) as a free PDF — made with the generator above so you can tweak and reprint.
↓ Download PDF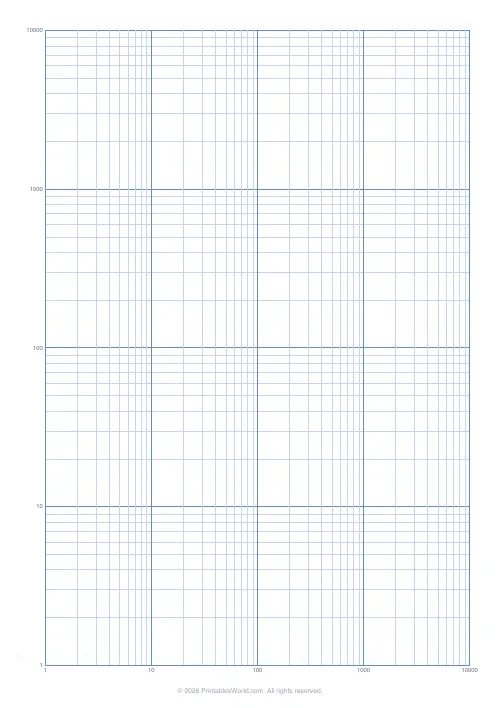
Log-Log Graph Paper — 4 decades
Print-ready log-log graph paper (4 decades) as a free PDF — made with the generator above so you can tweak and reprint.
↓ Download PDF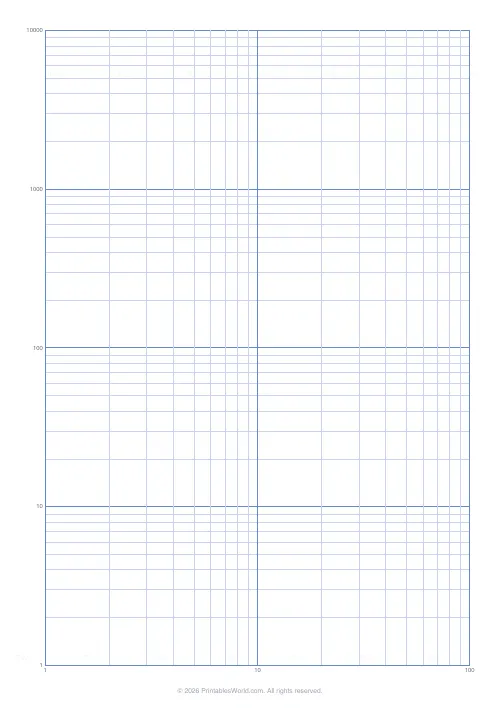
Log-Log Graph Paper — 2 decades
Print-ready log-log graph paper (2 decades) as a free PDF — made with the generator above so you can tweak and reprint.
↓ Download PDF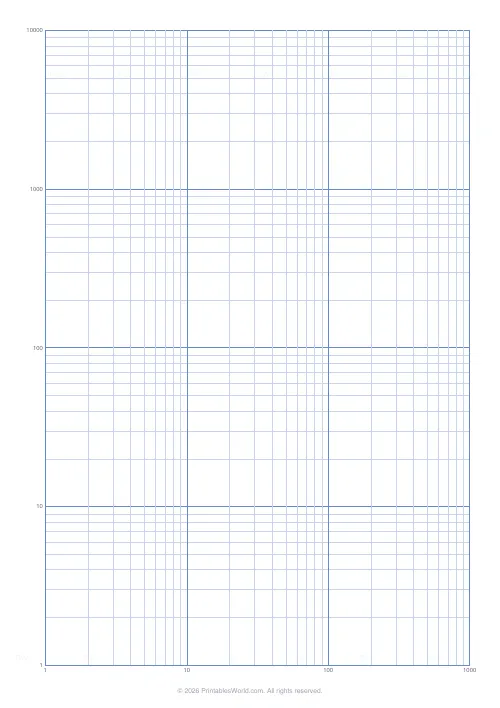
Log-Log Graph Paper — 3 decades
Print-ready log-log graph paper (3 decades) as a free PDF — made with the generator above so you can tweak and reprint.
↓ Download PDF
Log-Log Graph Paper — 4 decades
Print-ready log-log graph paper (4 decades) as a free PDF — made with the generator above so you can tweak and reprint.
↓ Download PDF
Settings
Customize your log-log paper
Logarithmic x-axis (4 decades) and y-axis (4 decades).
X decades
Y decades
Paper size
Preview
Live PDF preview
The actual PDF, updated as you change settings.
People also used
Feedback
Spotted something off with this tool?
Printable Log-Log Graph Paper for Power-Law Plots and Wide-Range Data
Log-log graph paper puts logarithmic scales on both axes so that data spanning several orders of magnitude fits on a single page, and so that power-law relationships of the form y = a·xn plot as straight lines. Download a print-ready PDF in A4 or US Letter with up to six decades on each axis, with minor rules at the 2 through 9 multiples of every decade. It is the paper engineers, physicists, and chemists reach for when a linear grid simply cannot express the range of the data.
For one logarithmic axis and one linear axis, see Semi-Log Paper. For conventional linear grids, use the Graph Paper Generator.
Why log-log paper?
A logarithmic scale compresses large ranges and expands small ones. A decade — a factor of ten — always takes up the same physical distance on the page, so 1 to 10 occupies the same width as 100 to 1,000 or 0.001 to 0.01. Use log-log paper when:
- your data spans several orders of magnitude on both axes
- you expect a power-law relationship such as y = a·xn
- you are plotting frequency response curves in electronics and acoustics
- you are characterising materials by stress-strain or creep data
- you are exploring allometric scaling in biology
- you are analysing financial or social data that spans many scales
- you are teaching logarithms, scientific notation, or curve fitting
Because power laws become straight lines on log-log paper, you can estimate the exponent n directly from the slope, which is often all you need for an early read on whether a hypothesis is plausible.
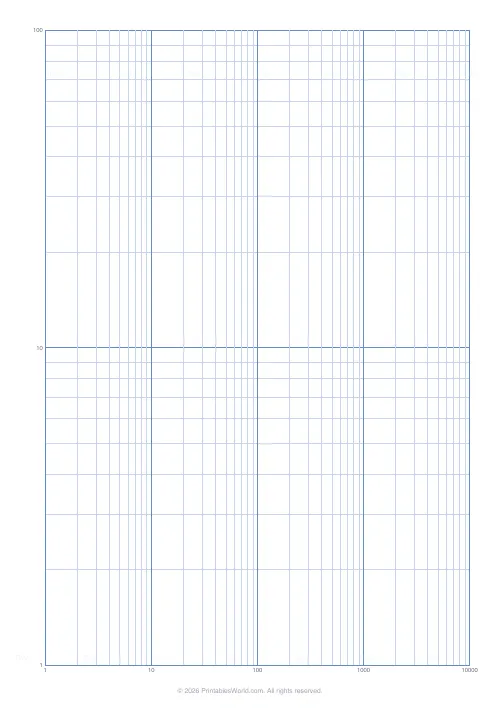
What is on the page
The template draws two perpendicular logarithmic axes. Each axis has major rules at every decade boundary (1, 10, 100, ...) and minor rules at the 2, 3, 4, 5, 6, 7, 8, 9 multiples within each decade. Both axes default to 4 decades, giving a 1 to 10,000 range — suitable for most laboratory and engineering plots.
- Decade span — choose 2 to 6 decades on each axis independently.
- Log-spaced minor rules — at the 2..9 multiples, not linear.
- Labelled major decades — 1, 10, 100, ... along both axes.
- Boxed plotting area — with outer border for a tidy frame.
Minor lines are drawn in a lighter weight so the decade grid reads clearly and you can still find intermediate values with precision.
Who this paper is for
Students
A-level, undergraduate, and postgraduate students in physics, chemistry, engineering, biology, and economics all use log-log plots at some point.
Designers & makers
Electronics hobbyists plotting frequency response of filters and amplifiers; product designers plotting material strength vs strain; anyone comparing data that spans scales.
Teachers
Print class sets for laboratory write-ups, for teaching curve fitting, and for introducing the idea that straight lines on log-log paper reveal power-law exponents.
Hobbyists
Astronomers plotting brightness vs distance, audio hobbyists plotting room acoustics, and citizen scientists working with wide-range datasets.
How to use the tool
- Pick the number of decades on the x-axis (2 to 6).
- Pick the number of decades on the y-axis (2 to 6).
- Choose A4 or US Letter.
- Click Generate.
- Preview and confirm the decade span matches your data.
- Download and print at 100% scale.
Worked example
Suppose you have measured the viscosity of a polymer melt at shear rates from 0.01 to 1,000 s-1 — a range of five decades — and the viscosity varies from 10 Pa·s to 100,000 Pa·s — four decades. Choose 5 decades on the x-axis (starting at 0.01) and 4 decades on the y-axis (starting at 10). Label the decades. Plot each data point on the log-log grid. If the points line up along a straight line with slope −0.7, you can read off a power-law exponent n = −0.7 for a pseudoplastic (shear-thinning) relationship η = K·γ-0.7.
Methodology
The template renders log-log paper by spacing major grid lines at equal physical distances per decade. For each decade, the minor rules are placed at positions log10(2), log10(3), ..., log10(9) multiplied by the decade width, giving you the true logarithmic positions for the 2..9 multiples. Both axes are treated independently, so you can choose 3 decades on one and 5 on the other without distortion. Every PDF passes through the shared printable-paper template, so branding and QR placement stay consistent across all paper templates.
Designed for A4 and US Letter printing
Both paper sizes render with the same decade count; the physical decade width changes to fit the page. Print at 100% scale so the grid stays geometrically exact. If you need identical decade widths for comparison between sheets, export on the same paper size each time.
Related printable paper tools
- Semi-Log Paper — one log axis and one linear
- Graph Paper Generator — linear grid paper
- 5 mm Graph Paper — everyday squared paper
- Isometric Grid Paper — for 3D technical drawing
FAQs
Quick answers
When should I use log-log paper?
When both variables span several orders of magnitude, or when you want a straight-line plot of a power law y = a·xⁿ.
How many decades does it span?
Choose 2–6 decades on each axis. Default is 4×4.
Are minor grid lines included?
Yes — log-spaced minor lines at the 2..9 multiples of each decade on both axes.
Will it print on A4?
Yes — A4, US Letter, and US Legal are supported.
Related tools