Printable Paper
Semi-Log Graph Paper
Linear x-axis with a logarithmic y-axis for exponential data.
Last updated:
What this tool does
Semi-log graph paper — linear x-axis and logarithmic y-axis. Default span is 4 decades on the y-axis (1–10,000) with 10 linear divisions on x. Ideal for exponential growth/decay plots.
Free downloads
Ready-made Semi-Log Graph Paper printables — free PDF downloads
No setup needed — download these print-ready semi-log graph paper as free PDFs. Each one was made with the generator above, so you can recreate or fully customize any of them.
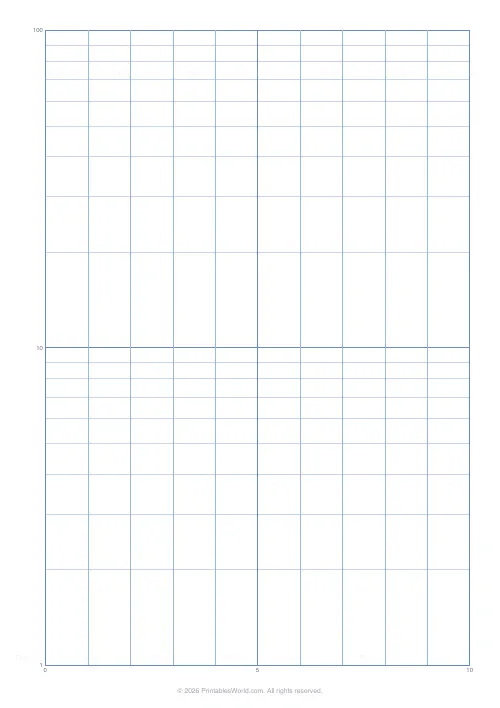
Semi-Log Graph Paper — 2 decades
Print-ready semi-log graph paper (2 decades) as a free PDF — made with the generator above so you can tweak and reprint.
↓ Download PDF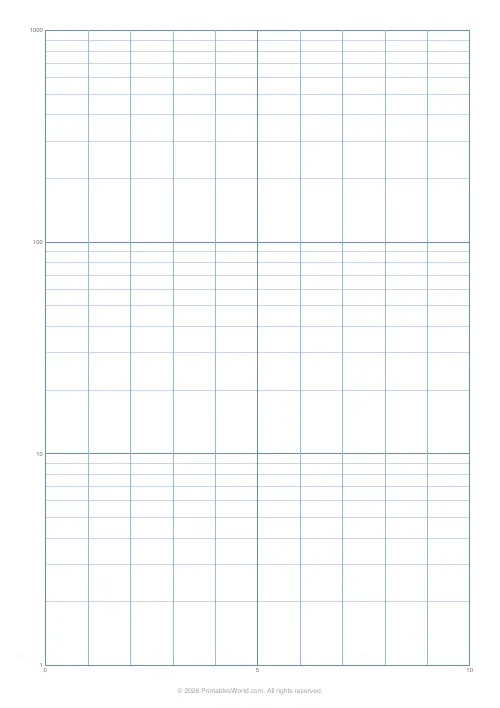
Semi-Log Graph Paper — 3 decades
Print-ready semi-log graph paper (3 decades) as a free PDF — made with the generator above so you can tweak and reprint.
↓ Download PDF
Semi-Log Graph Paper — 4 decades
Print-ready semi-log graph paper (4 decades) as a free PDF — made with the generator above so you can tweak and reprint.
↓ Download PDF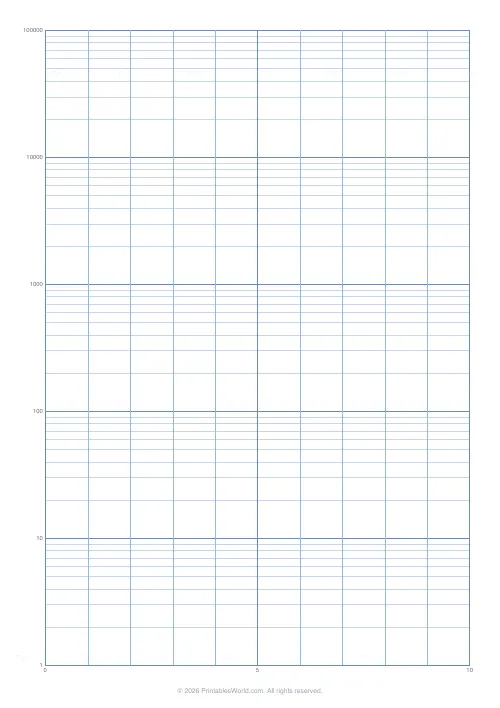
Semi-Log Graph Paper — 5 decades
Print-ready semi-log graph paper (5 decades) as a free PDF — made with the generator above so you can tweak and reprint.
↓ Download PDF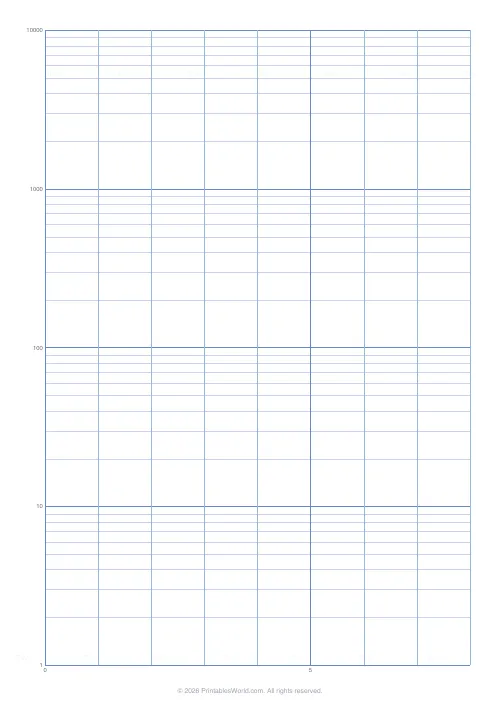
Semi-Log Graph Paper — 8 divisions
Print-ready semi-log graph paper (8 divisions) as a free PDF — made with the generator above so you can tweak and reprint.
↓ Download PDF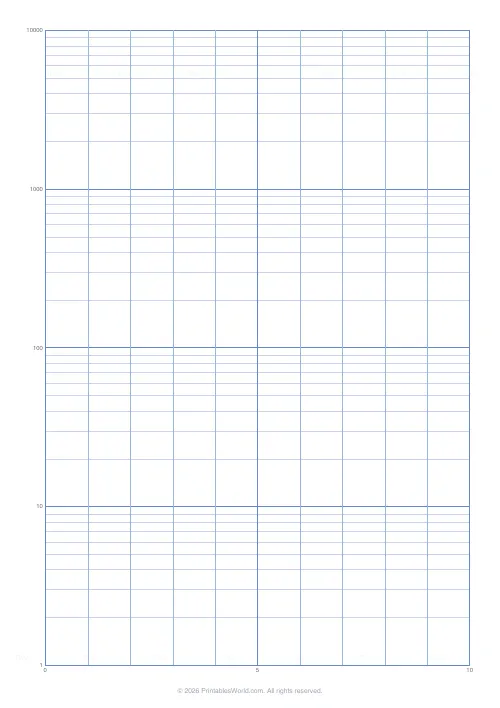
Semi-Log Graph Paper — 10 divisions
Print-ready semi-log graph paper (10 divisions) as a free PDF — made with the generator above so you can tweak and reprint.
↓ Download PDF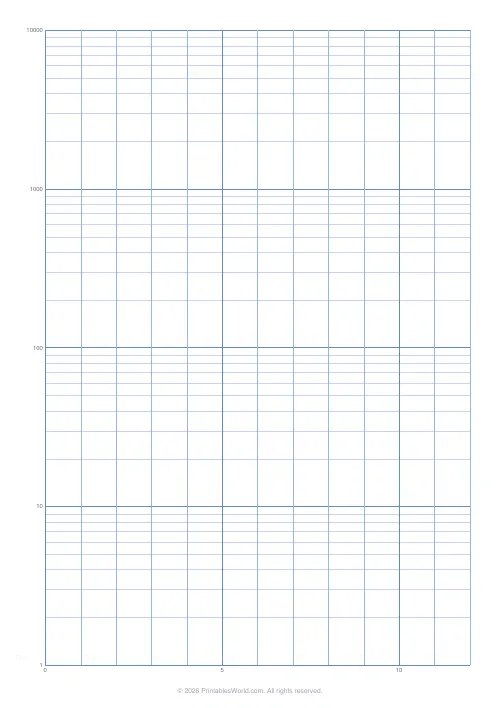
Semi-Log Graph Paper — 12 divisions
Print-ready semi-log graph paper (12 divisions) as a free PDF — made with the generator above so you can tweak and reprint.
↓ Download PDF
Settings
Customize your semi-log paper
Linear x-axis with 10 divisions, log y-axis spanning 4 decades.
Log decades (y)
Linear divisions (x)
Paper size
Preview
Live PDF preview
The actual PDF, updated as you change settings.
People also used
Feedback
Spotted something off with this tool?
Printable Semi-Log Graph Paper for Exponential Data
A printable semi-log grid — a linear x-axis paired with a logarithmic y-axis that spans two to six decades. Use it to plot exponential growth and decay, power-law relationships, and any dataset whose values stretch across orders of magnitude.
On a semi-log plot, an exponential curve becomes a straight line, which makes parameters such as the growth rate or half-life easy to read off the page. Output is a single-page PDF in A4 or US Letter, print-ready at 100% scale.
Because semi-log paper is hard to find in ordinary stationery shops, a printable version is the most reliable way to get an accurate log axis for lab reports, homework, and engineering sketches.
Why use semi-log paper?
Any variable that changes exponentially is awkward to plot on normal graph paper — values at the low end get squashed into a thin band, and the curve runs off the page at the high end. Plotting the same data on a semi-log grid turns exponential curves into straight lines and spreads out the low values so you can actually read them. Common uses include:
- bacterial or yeast growth curves
- radioactive decay and half-life measurements
- pH and hydrogen-ion concentration
- decibel and sound-intensity plots
- capacitor charging and discharging
- pharmacokinetic drug-concentration curves
- population growth and compound interest
Students meet semi-log paper in biology, chemistry, physics, and A-level statistics, as well as in university engineering and economics courses.
What you can customise
- Decades on the log axis: 2, 3, 4, 5, or 6
- Linear divisions on the x-axis: 10 or 20
- Paper size: A4, US Letter, or US Legal
Four decades — the default — covers a range from 1 to 10,000, which is enough for most school biology and chemistry experiments. Pick 6 decades for exponential decay over many half-lives, or 2 decades if your data fits tidily within two orders of magnitude.
What the template contains
The x-axis is evenly divided — typically ten linear divisions, each subdivided into smaller increments — and runs across the bottom of the plot area. The y-axis is divided into decades (1–10, 10–100, 100–1000, and so on), with log-spaced minor gridlines at 2, 3, 4, 5, 6, 7, 8, and 9 inside every decade. Major decade labels run up the left-hand side.
A bold outer border frames the plot area, and the major log-decade lines are drawn heavier than the minor divisions so the scale reads at a glance.
Who this paper is for
Students
Plot lab data that spans many orders of magnitude — bacterial growth curves, radioactive decay, or pH measurements — and fit a straight line to extract constants.
Teachers
Hand out a class set for exponential-function lessons. Plotting by hand makes the relationship between the straight-line slope on semi-log paper and the exponent in the underlying equation far more concrete.
Engineers and scientists
Quickly sketch decay constants, Bode-like magnitude plots, and frequency-response curves without opening software.
Hobbyists
Track exponential processes at home — sourdough starter activity, compound-interest on savings, or plant growth over weeks.
How to use the template
- Choose the number of decades your y-axis needs to cover.
- Choose the number of linear divisions on the x-axis.
- Pick your paper size.
- Click Generate.
- Download the PDF and print at 100% scale.
- Label the x-axis with your independent variable (often time).
- Label each y-axis decade so it starts at the right power of ten.
- Plot each data point and fit a line by eye or ruler.
Worked example
Imagine you are tracking a bacterial culture that doubles every twenty minutes. After zero minutes you have 100 cells; after forty minutes, 400; after eighty, 1,600; after two hours, 6,400; and after three hours, close to 64,000. On ordinary graph paper those early values are unreadable, but on semi-log paper the five points fall on a near-perfect straight line.
Use 4 decades on the log axis to cover 100 to 100,000 and a linear x-axis divided into ten 20-minute steps. Plot each point, draw a line of best fit, and read the doubling time from the slope — one decade of change in roughly 1 hour 6 minutes, matching the expected 20-minute doubling for this culture.
Methodology
The y-axis is calculated using the standard base-10 logarithm. Within each decade, minor gridlines fall at log10(2) ≈ 0.301, log10(3) ≈ 0.477, and so on — the familiar uneven spacing that compresses as you move up the decade. Major decade lines are drawn heavier so the decade boundaries read at a glance.
The PDF is generated as vector output, so every line is printed cleanly at any zoom. Print at 100% scale with "fit to page" disabled so the decade spacing is accurate — it matters if you intend to measure slopes with a ruler.
Designed for A4 and US Letter printing
Both A4 and US Letter are supported. On A4 the plot area fills a portrait region with roughly equal width and height per decade. On US Letter the proportions are slightly different, but the decade spacing on the log axis and the division count on the linear axis stay identical — only the absolute size in millimetres changes. US Legal gives you a taller plot for data that spans many decades.
Tips for plotting on semi-log paper
- Always label each decade explicitly (1, 10, 100, 1000, 10000) — the log spacing makes it easy to mis-read.
- Use a sharp pencil for plotting and a pen for the final line of best fit.
- If a data point falls outside the decade range, extend the chart by printing another page and taping them together.
- A straight line on semi-log paper implies an exponential relationship. If the plot curves, consider using log-log paper instead.
- Mark the slope calculation — e.g. "one decade per 66 minutes" — beside the line of best fit so the interpretation is obvious.
Related printable paper templates
You may also find these related printable-paper tools useful:
FAQs
Quick answers
What is semi-log paper for?
Plotting data that spans many orders of magnitude on one axis — bacterial growth, decibel levels, pH curves, and exponential decay.
How many decades does it span?
Choose 2–6 decades on the log axis depending on your data.
Are minor lines included?
Yes — log-spaced minor lines mark intervals 2–9 within each decade.
Will it print on A4?
Yes — A4, US Letter, and US Legal are supported.
Related tools